Report

Employment Discrimination Based on Sexual Orientation and Gender Identity in North Carolina

October 2014

North Carolina’s employment non-discrimination laws do not include sexual orientation or gender identity, leaving LGBT people in the state vulnerable to discrimination. Adding these characteristics to North Carolina’s existing laws would provide protections to LGBT people and would not be costly or burdensome for the state to enforce.

Highlights
Discrimination against LGBT people in North Carolina has been documented in surveys, court cases, and the media.
Some local governments and private employers in North Carolina have adopted non-discrimination protections for LGBT people, but coverage is incomplete.
Public opinion in North Carolina supports the passage of non-discrimination protections for LGBT people.
Data Points
159,000
LGBT people aged 16+ are in North Carolina’s workforce
Report

Executive Summary

More than 4% of the American workforce identifies as lesbian, gay, bisexual, or transgender (LGBT). Approximately 159,000 of these workers live in North Carolina. North Carolina does not have a statewide law that prohibits discrimination based on sexual orientation or gender identity in employment.

This report summarizes evidence of sexual orientation and gender identity employment discrimination, explains the limited current protections from sexual orientation and gender identity employment discrimination in North Carolina, and estimates the administrative impact of passing a law prohibiting employment discrimination based on these characteristics in the state.

Key Findings

  • In total there are approximately 258,000 LGBT adults in North Carolina, including 159,000 who are part of North Carolina’s workforce.1
  • Media reports and lawsuits document incidents of sexual orientation and gender identity discrimination against employees in North Carolina, including several public school teachers and a law enforcement officer.
  • Survey data indicate that discrimination against LGBT workers is prevalent across the country. Most recently, a 2013 Pew Research Center survey found that 21% of LGBT respondents had been treated unfairly by an employer in hiring, pay, or promotions.
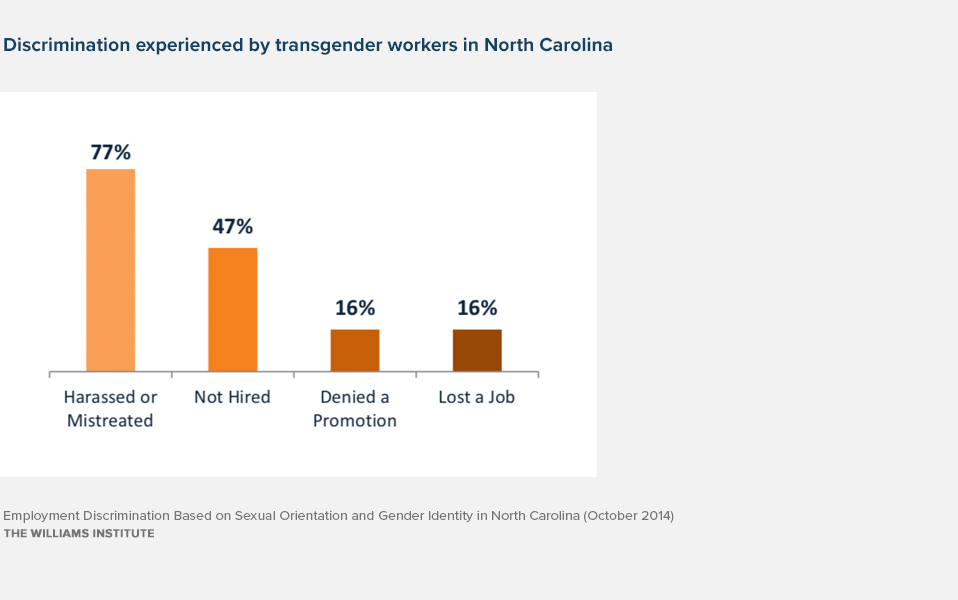
  • When transgender people are surveyed separately, they report similar or higher levels of discrimination. For example, as recently as 2010, 78% of respondents to the largest survey of transgender people to date reported having experienced harassment or mistreatment at work, and 47% reported having been discriminated against in hiring, promotion, or job retention because of their gender identity. In response to the survey, 77% of the transgender respondents from North Carolina reported experiencing discrimination or harassment at work.
  • Disparities in wages are another way that discrimination has traditionally been measured. Census data show that in North Carolina, the median income of men in same-sex couples is 16%lower than the median income of men in different-sex marriages.
  • None of North Carolina’s private sector workforce is expressly protected from discrimination based on sexual orientation or gender identity. At least seventeen North Carolina counties and municipalities have local ordinances or personnel policies that protect government employees from discrimination based on sexual orientation, and at least eight localities also protect employees from discrimination based on gender identity.
  • Approximately 98% of North Carolina’s workforce is not covered by a local government policy that prohibits sexual orientation or gender identity discrimination in employment.2
  • Eleven of the 12 Fortune 500 companies based in North Carolina have internal policies that prohibit discrimination based on sexual orientation, and six also prohibit discrimination based on gender identity. In addition, 13 campuses in the University of North Carolina system prohibit employment discrimination based on sexual orientation, and five prohibit discrimination based on gender identity.
  • Public opinion in North Carolina supports the passage of legal protections from workplace discrimination for LGBT people. In response to a 2013 survey, 73% of respondents said that employers in the state should not be able to discriminate against their employees based on sexual orientation or gender identity. In addition, other polls find that 81% of North Carolina residents think that LGBT people experience a moderate amount to a lot of discrimination in the state.
  • Adding sexual orientation and gender identity to the state’s current non-discrimination laws would result in approximately 58 additional complaints being filed each year; 50 filed by private-sector workers in the courts, and eight filed administratively by government workers.
  • Because North Carolina’s judicial system has a heavy caseload which has varied from 2,812,988 cases to 3,384,274 cases annually over the past five fiscal years, it is likely that an additional 50 complaints would have no noticeable impact on the system’s existing budget with no need for additional resources or staff. Although there are not enough data to estimate the impact of eight additional administrative complaints filed with the Office of State Human Resources per year, we anticipate that the impact would be minimal given the small number of complaints.

Download the full report

Employment Discrimination Based on Sexual Orientation and Gender Identity in North Carolina

These estimates were reached by applying the percentage of people in North Carolina that are LGBT (3.3 percent) to the population of North Carolina aged 16 years and older (7,810,152) and the number of people in the North Carolina civilian labor force (4,820,861), respectively. Gary J. Gates & Frank Newport, LGBT Percentage Highest in D.C., Lowest in North Dakota, Gallup, Feb. 15, 2013, http://www.gallup.com/poll/160517/lgbt-percentage-highest-lowest-north-dakota.aspx; American Community Survey, U.S. Census Bureau, American FactFinder, 2012 ACS Table DP03: Selected Economic Characteristics, 1-Year Estimates,
http://factfinder2.census.gov/faces/tableservices/jsf/pages/productview.xhtml?pid=ACS_12_1YR_DP03&prodTyp e=table.

Calculated by authors using data from the American Community Survey, 2010-2012 1-Year-Estimates & 2008-2012 5-Year-Estimates, Select Economic Characteristics tables (civilian labor force numbers) available at http://factfinder2.census.gov/faces/nav/jsf/pages/index.xhtml (last visited Sept. 30, 2014).