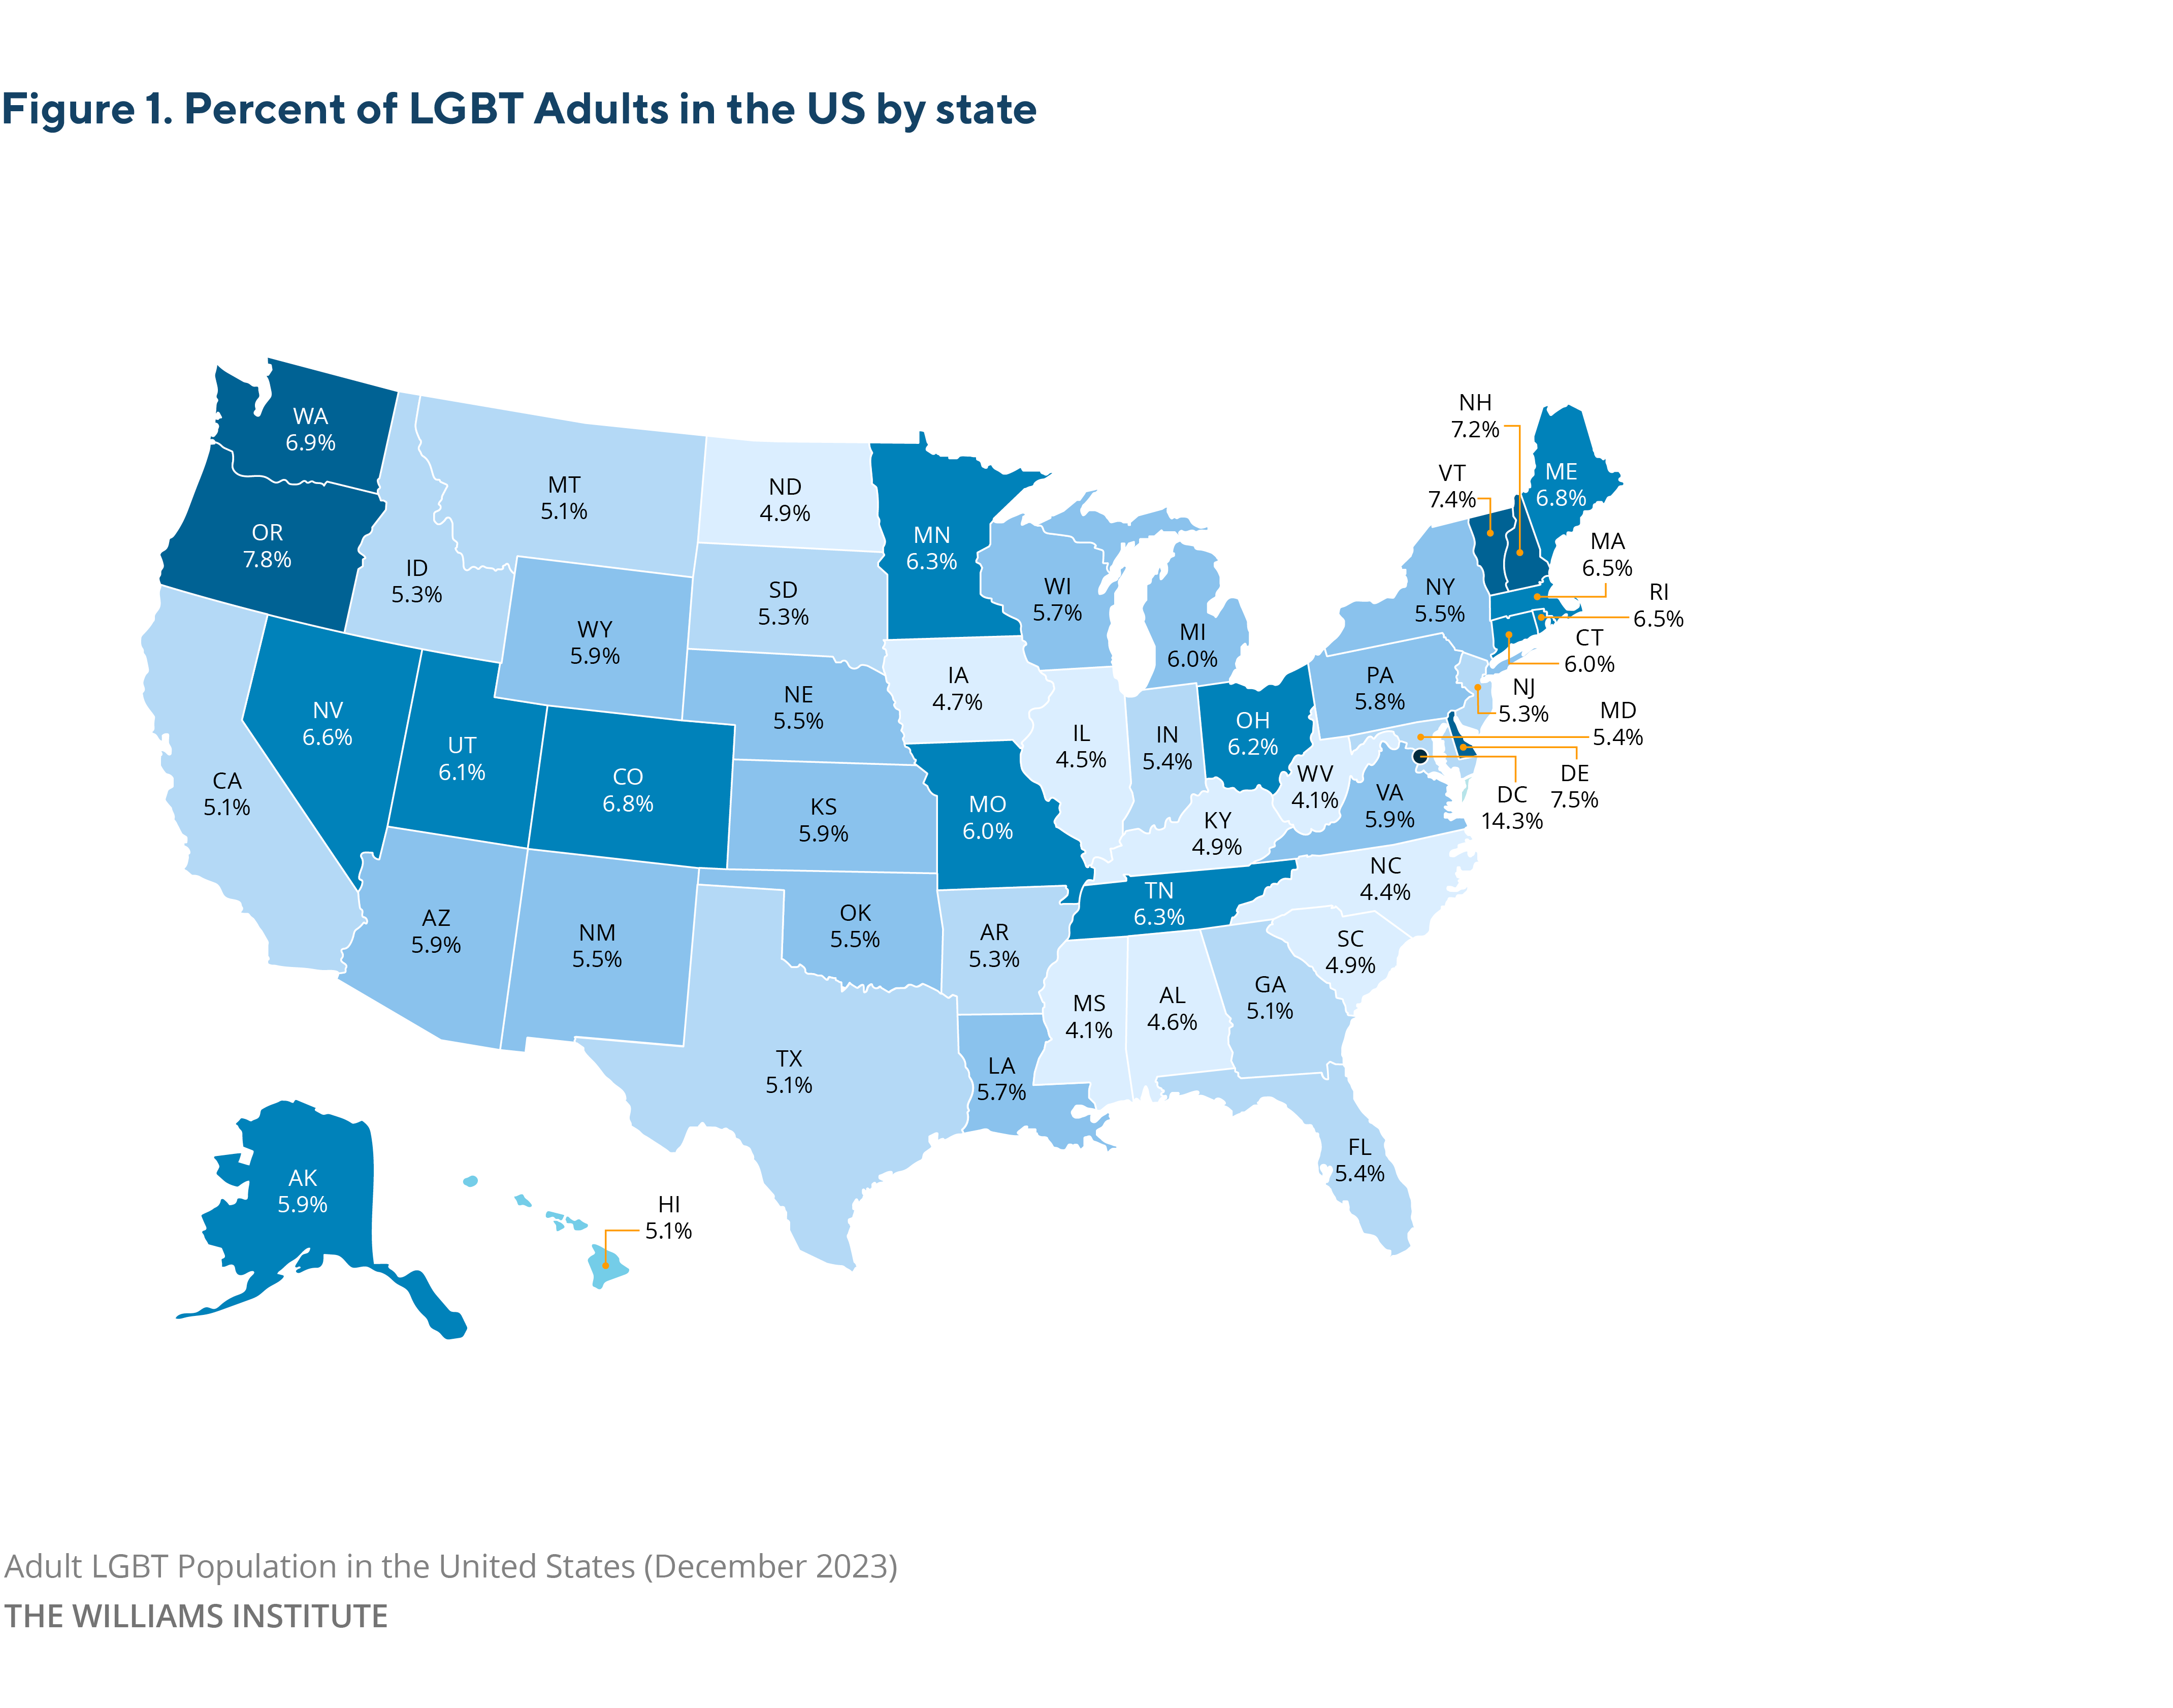
This report provides estimates of the number and percent of the U.S. adult population that identifies as LGBT, overall, as well as by age. Estimates of LGBT adults at the national, state, and regional levels are included. We rely on BRFSS 2020-2021 data for these estimates. Pooling multiple years of data provides more stable estimates—particularly at the state level.
Combining 2020-2021 BRFSS data, we estimate that 5.5% of U.S. adults identify as LGBT. Further, we estimate that there are almost 13.9 million (13,942,200) LGBT adults in the U.S.
Regions and States
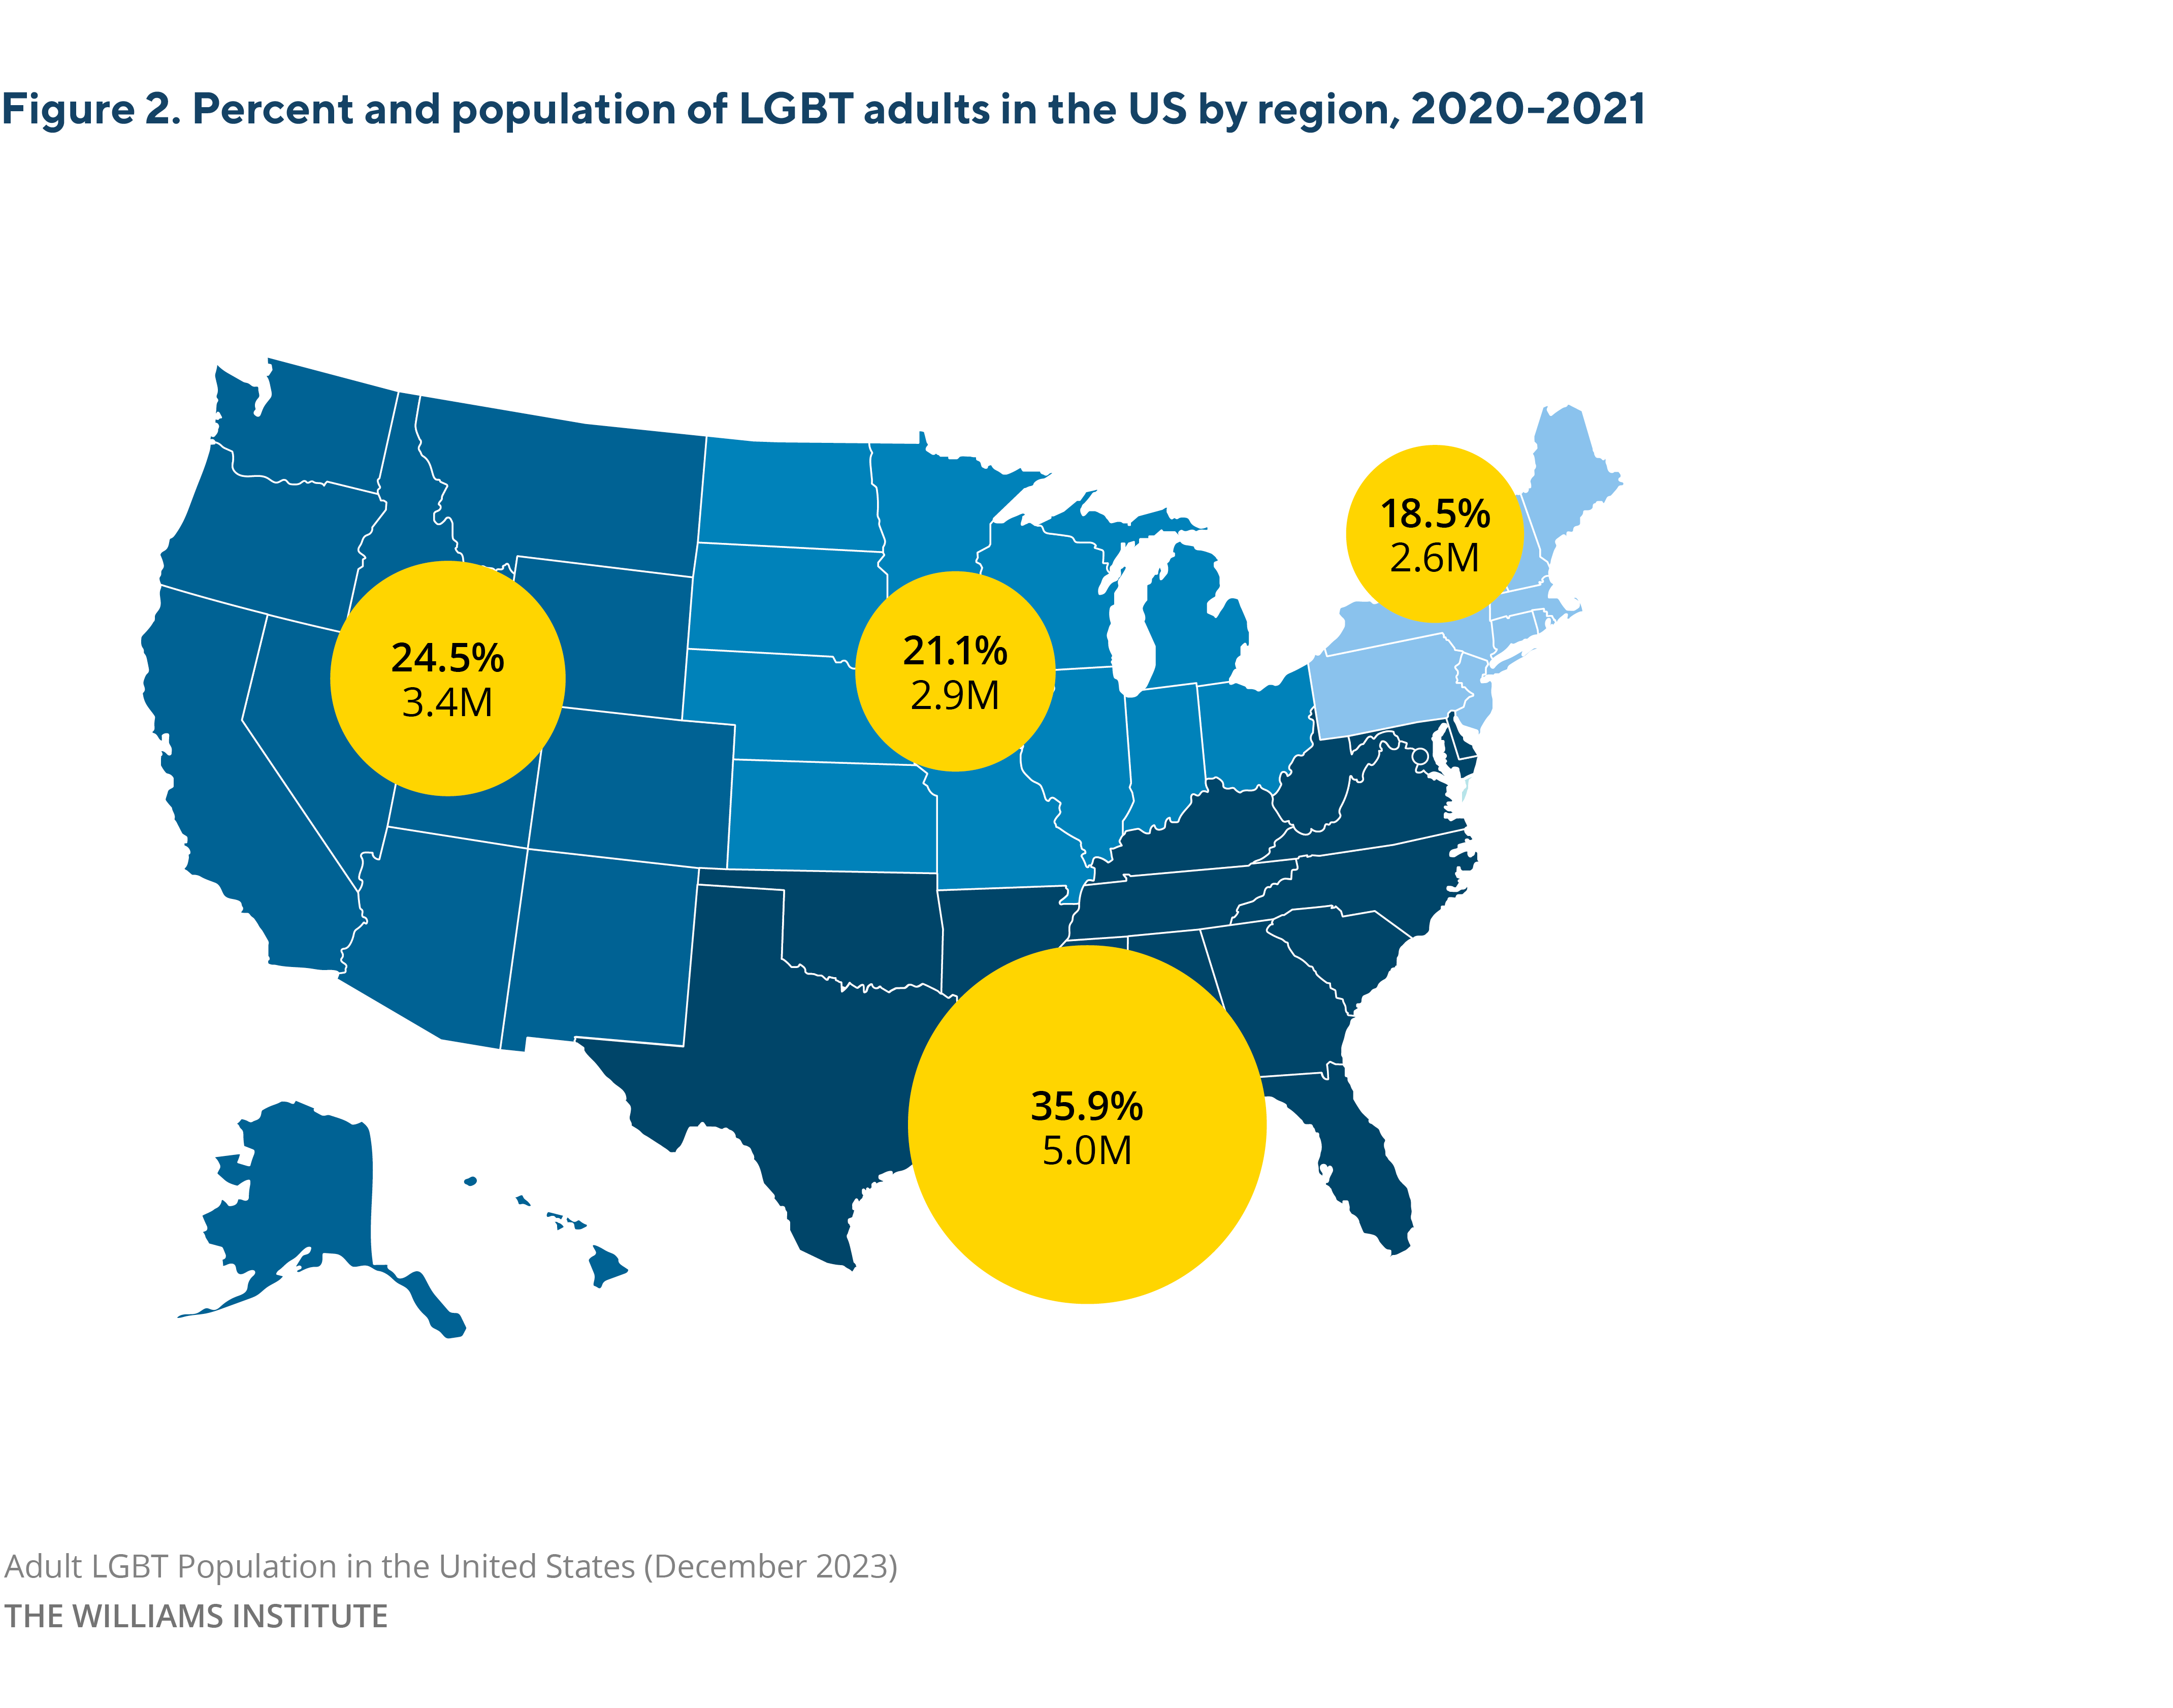
LGBT people reside in all regions of the U.S. (Table 2 and Figure 2). Consistent with the overall population in the United States, more LGBT adults live in the South than in any other region. More than half (57.0%) of LGBT people in the U.S. live in the Midwest (21.1%) and South (35.9%), including 2.9 million in the Midwest and 5.0 million in the South. About one-quarter (24.5%) of LGBT adults reside in the West, approximately 3.4 million people. Less than one in five (18.5%) LGBT adults live in the Northeast (2.6 million).
The percent of adults who identify as LGBT differs by state.
In terms of the number of LGBT adults, the top states with the largest number of LGBT adults are also the states with the largest overall populations, except for Washington, which is 13th in terms of overall adult population and 10th in terms of the adult LGBT population.[footnote id=’2′]
Age
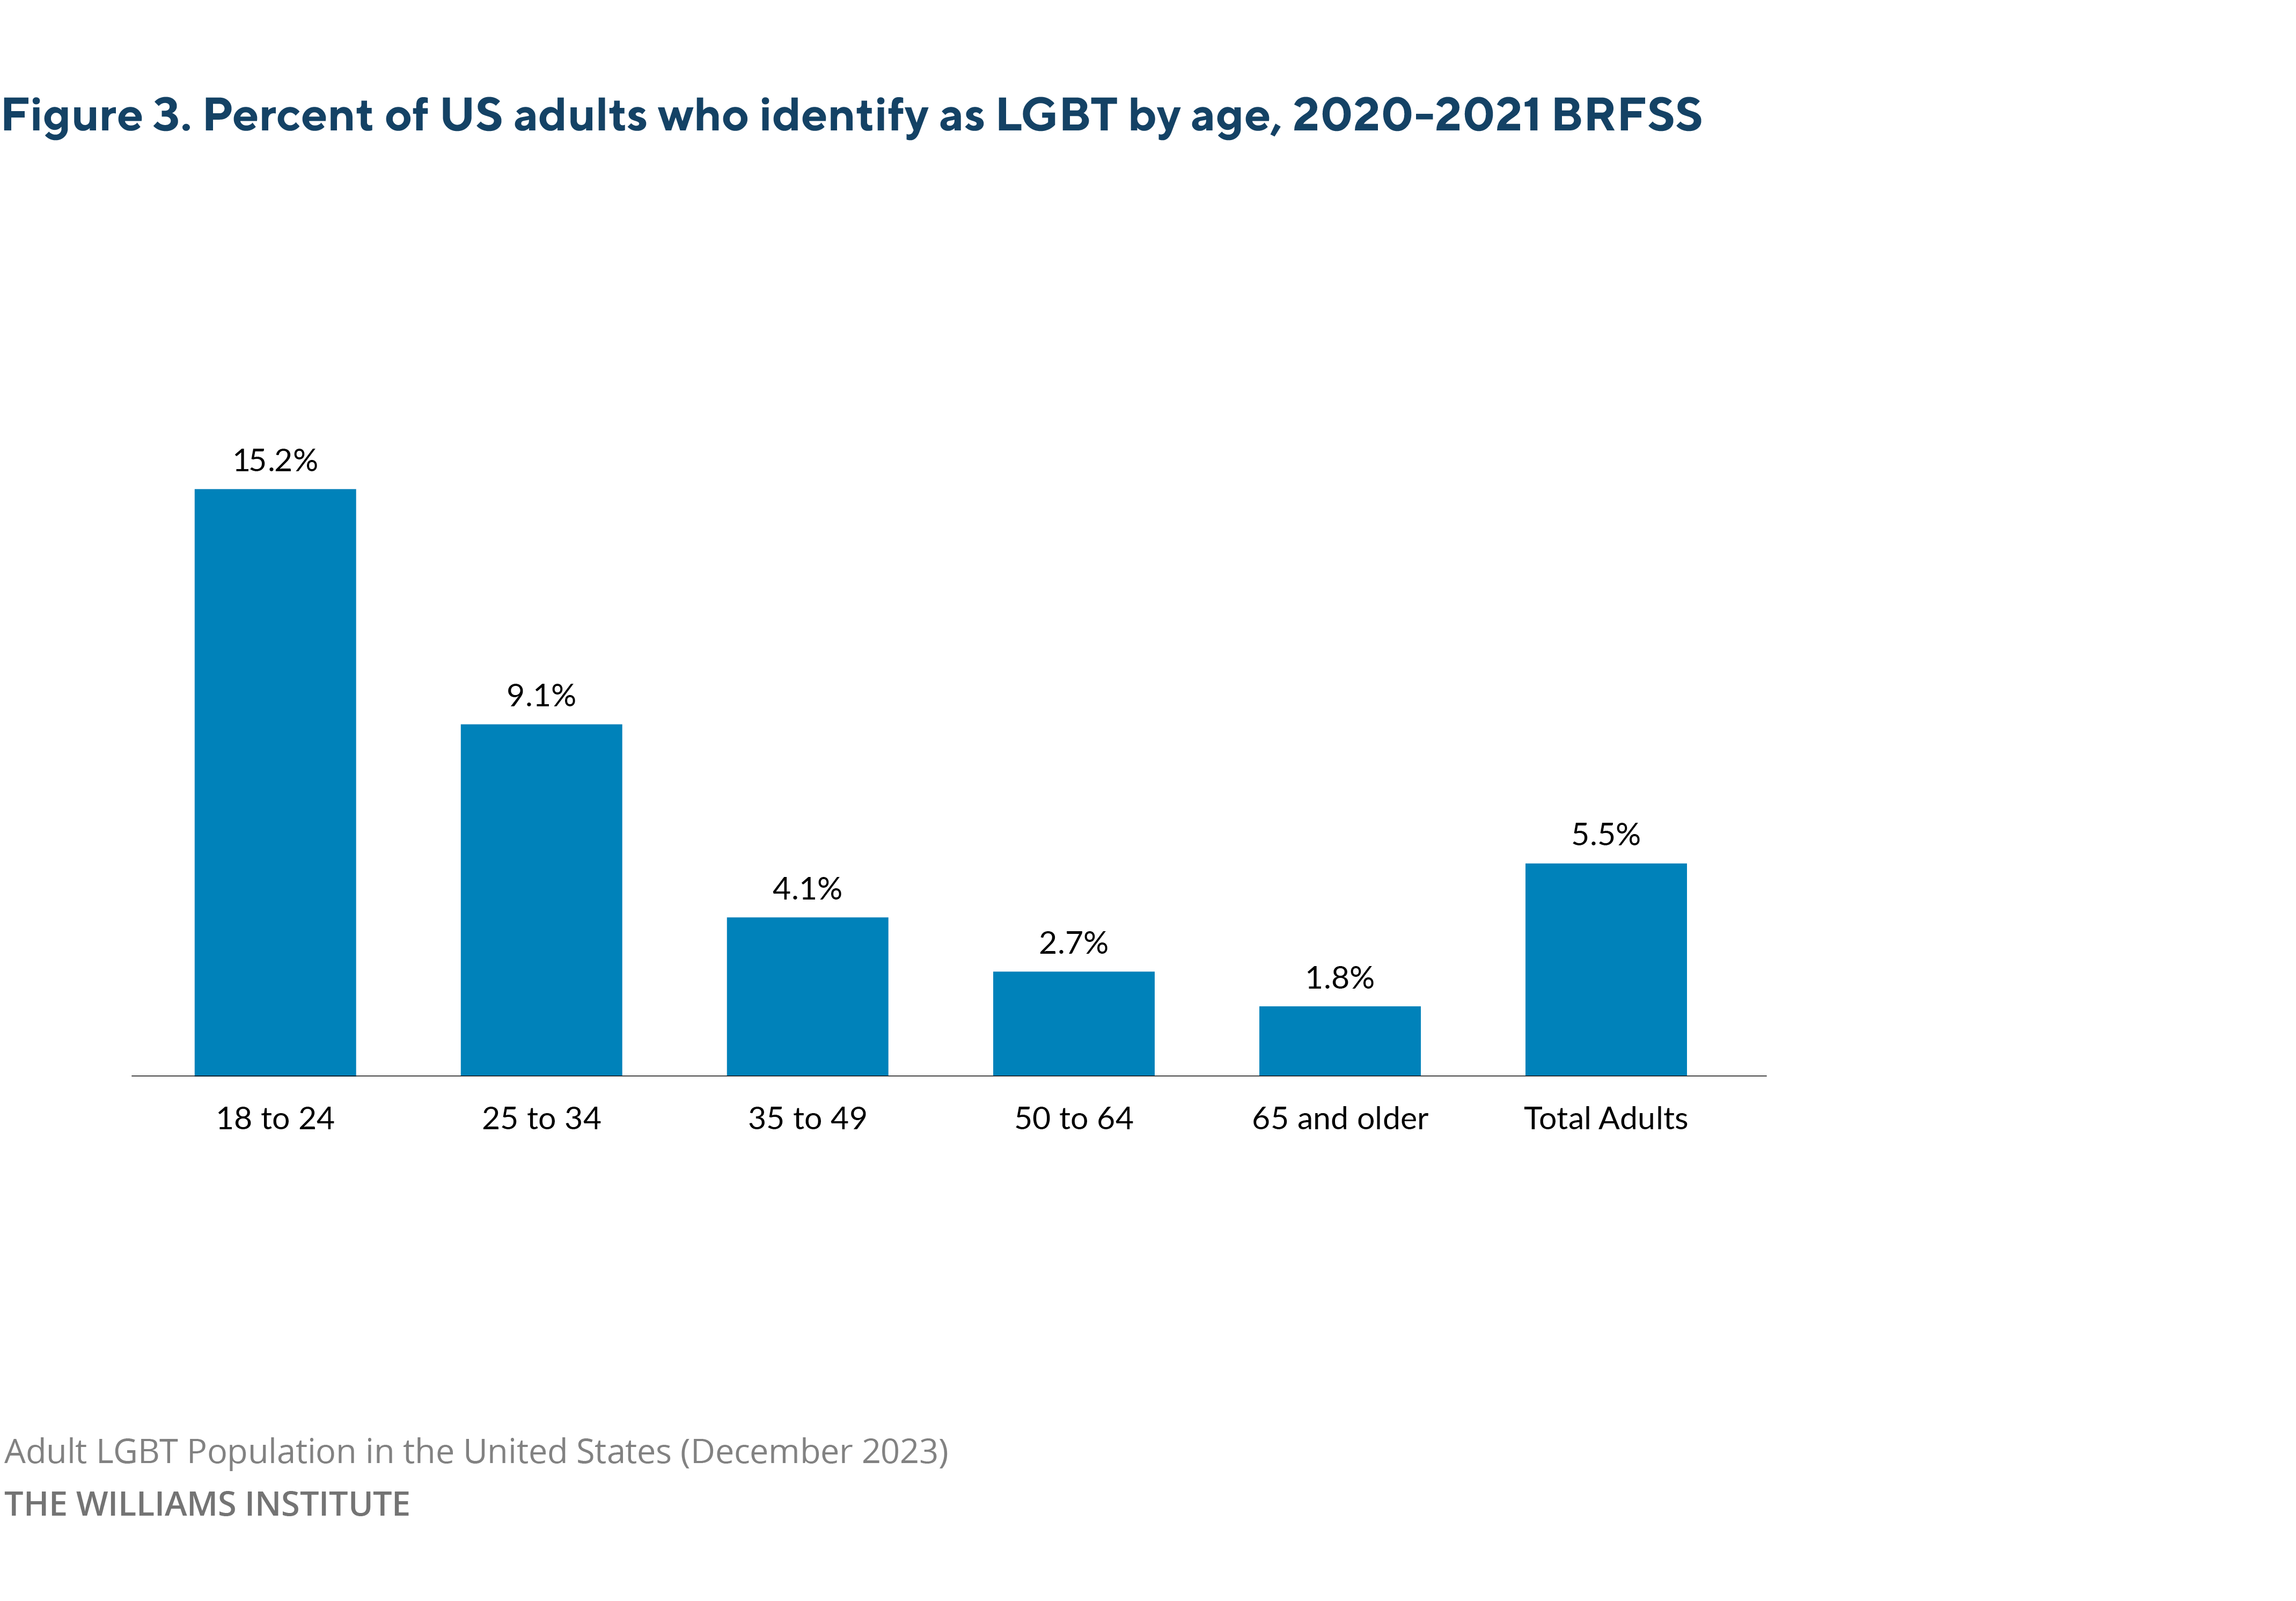
As shown in Table 5 and Figure 3, LGBT identification varies by age.
Nearly one in six young adults (ages 18 to 24) identifies as LGBT, while fewer adults identify as LGBT at the older end of the age continuum. Almost one in ten (9.1%) of those 25 to 34 years old, less than 5% of those ages 35 to 49, and less than 3% of those ages 50 and older identify as LGBT.
Regional and state-level LGBT estimates by age are provided in Appendix A2a.
Download the full report
Download the 2020 version
Download the 2019 version


