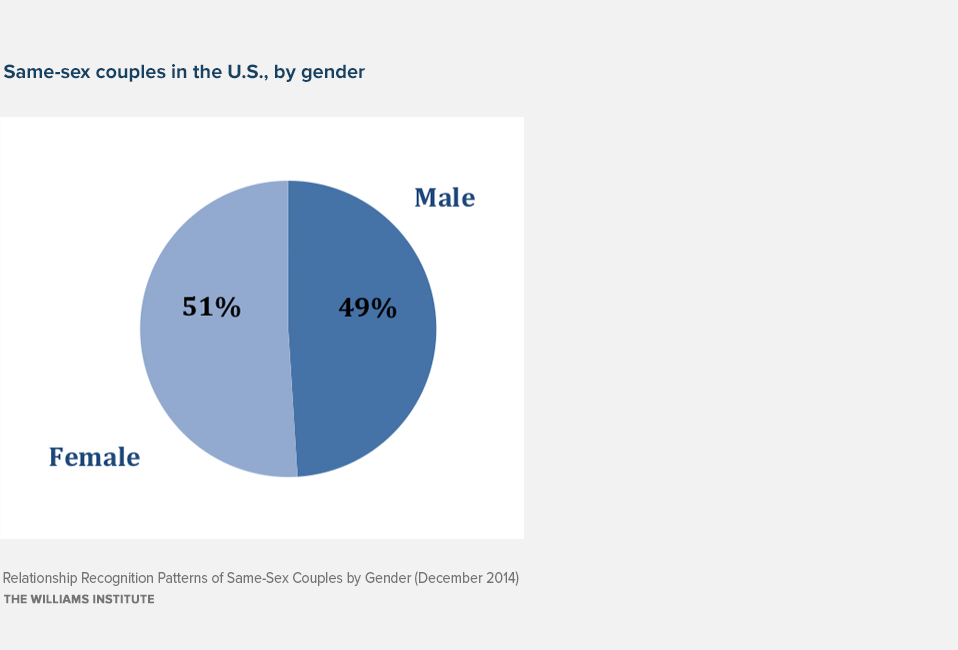
Female same-sex couples account for just over half (51%) of all same-sex couples in the U.S. However, data from states that allow same-sex couples to formalize their relationships through marriage, civil unions, or domestic partnerships show that 64% of same-sex couples are female, a much higher proportion than would be expected.
Fact Sheet
Relationship Recognition Patterns of Same-Sex Couples by Gender
December 2014
This study uses state administrative data to compare rates at which same-sex couples formalize their relationships through marriages, civil unions, and domestic partnerships by gender.
Fact Sheet
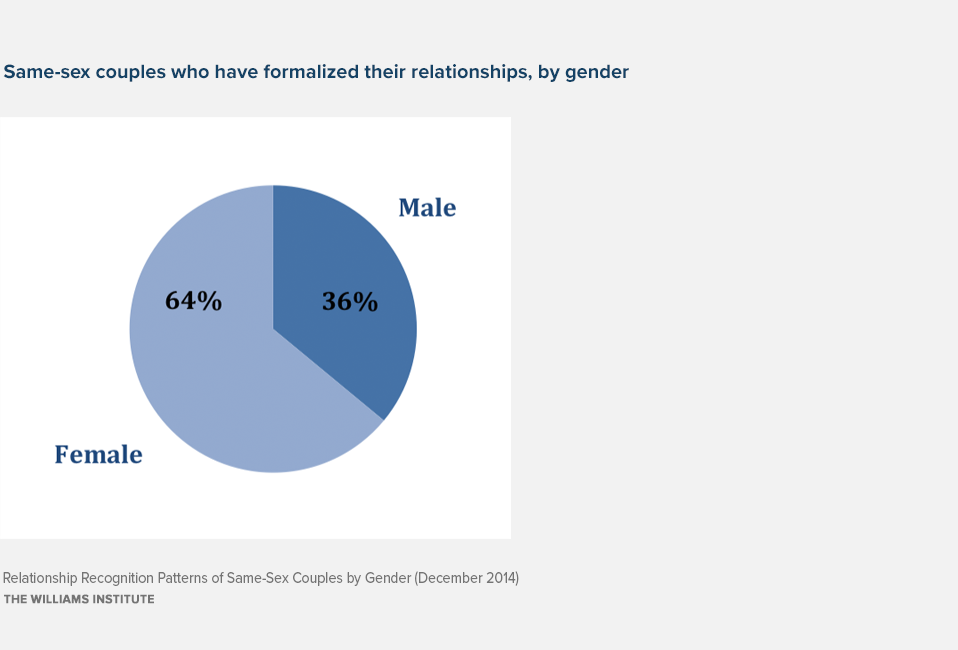
Across the ten states that provided data, 64% of all same-sex couples who entered legal statuses were female couples. In states that recognize marriage for same-sex couples, the percentage of same-sex couples marrying who were female ranged from 54% in Rhode Island to 70% in New Hampshire. On average, 62% of same-sex couples who married were female. In states that offer domestic partnerships and civil unions, the percentage of same-sex couples entering legal statuses who were female ranged from 58% in Rhode Island to 72% in Oregon. On average, 64% of same-sex couples who entered a non-marital status were female.
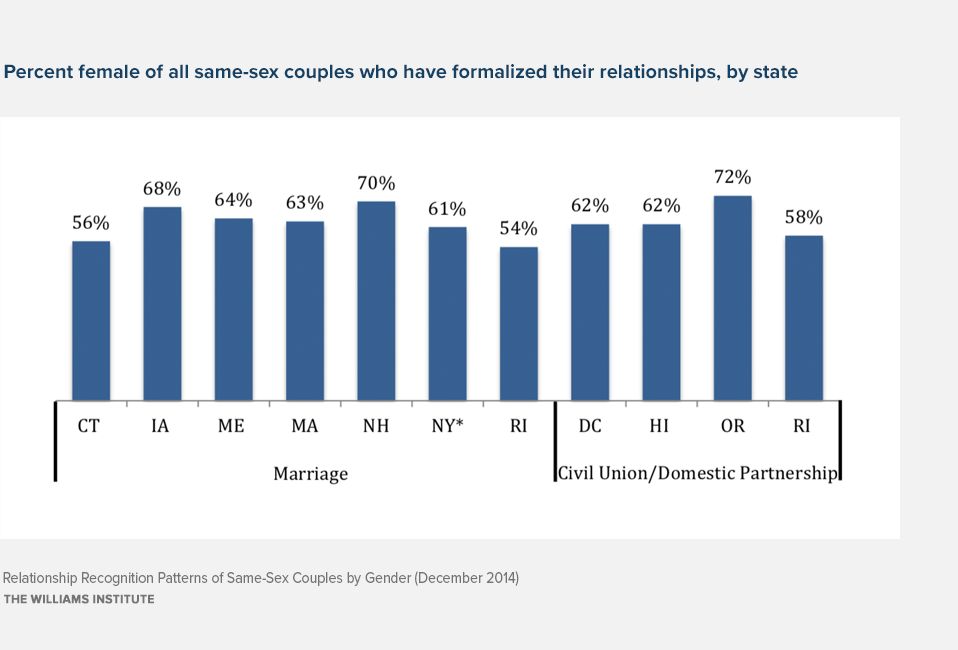
*Data from New York State do not include marriage licenses issued in New York City
These figures come from administrative data on same-sex couples who had formalized their relationships under state law in the 23 states that allowed same-sex couples to enter into legal statuses when the Williams Institute collected the data in 2014. All states were asked to provide a breakdown of recognition by gender, and ten states were able to provide data in this way. The ten states that provided such data were Connecticut, D.C., Hawaii, Iowa, Maine, Massachusetts, New Hampshire, New York, Oregon, and Rhode Island. Another 12 states reported that they do not track data in a way that makes break down by gender possible, and one state was unable to provide any data on a same-sex couple who had entered into legal statuses. The administrative data used in these calculations do not take dissolutions into account, so they provide information about couples who have ever formalized their relationship rather than couples who are currently married.
Data from the 2013 National Health Interview Survey (NHIS) provide information about the gender of couples who are currently married. NHIS data are consistent with the administrative data in showing that currently married couples are also more likely to be female. Of legally married same-sex couples identified in NHIS data, 64% identified as female and 36% identified as male.
Gary J. Gates & Abigail M. Cooke, The Williams Inst., United States Census Snapshot: 2010, http://williamsinstitute.law.ucla.edu/wp-content/uploads/Census2010Snapshot-US-v2.pdf?r=1(last visited Oct. 23, 2014).
Gary J. Gates, The Williams Inst., LGB Families and Relationships: Analyses of the 2013 National Health Interview Survey 2 (2014), http://williamsinstitute.law.ucla.edu/wp-content/uploads/lgb-families-nhis-sep-2014.pdf.
Id.
Id.