Executive Summary
The US Census Bureau’s 2013 American Community Survey marked the first time that a large national demographic survey explicitly identified both married and unmarried same-sex couples, allowing for separate analyses of these two groups. These analyses outlined below compare the demographic, economic, and geographic characteristics of these two groups, especially those raising children. Comparisons are also made with married and unmarried different-sex couples.
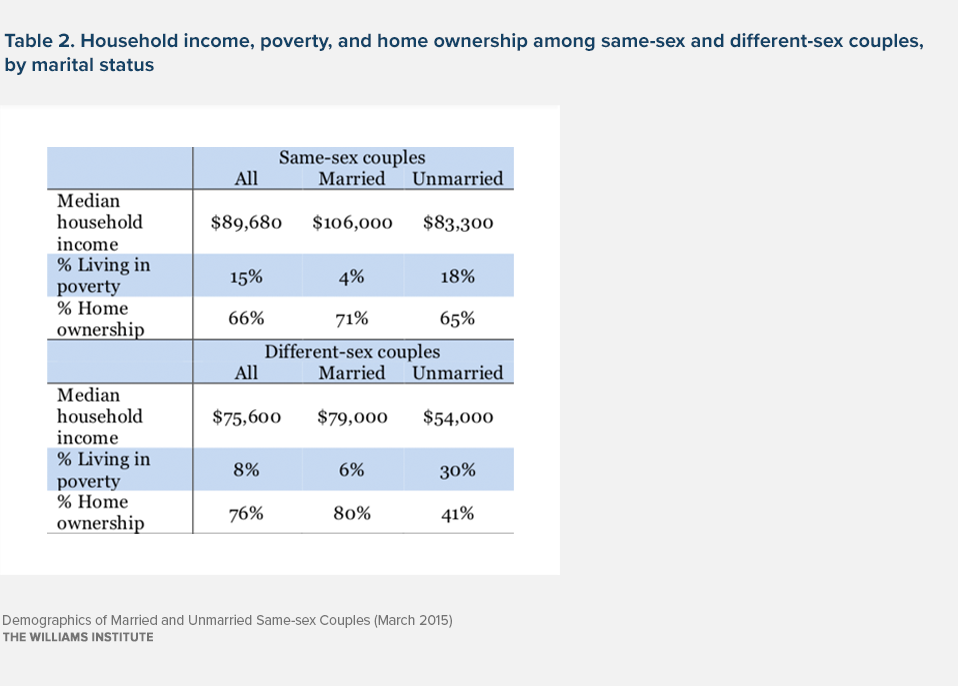
Substantial research suggests that marriage is associated with lower economic vulnerability in couples and families. Although marriage for same-sex couples has only recently become available for most couples in the United States, economic advantages associated with marriage are evident among same-sex couples in ways that are similar to their different-sex counterparts. For example, married same-sex couples have a median household income that is approximately 27% higher than the median income of unmarried same-sex couples. Also, poverty is substantially less common among married same-sex couples (4%) than among unmarried same-sex couples (18%).
An estimated 122,000 same-sex couples are raising children under age 18. The median annual household income of these couples is more than 5% lower than the median annual household income of different-sex couples raising children ($75,000 versus $79,220). However, married same-sex couples with children have a much higher median annual household income of $97,000, which exceeds that of married different-sex couples with children ($83,500) by 16%. Nearly one in five children being raised by same-sex couples (24%) live in poverty compared to 14% of children being raised by different-sex couples. Only 9% of children being raised by married same-sex couples live in poverty compared to 11% of children raised by married different-sex couples.
Even though same-sex couples are less likely to be raising children than are different-sex couples, they are much more likely to have adopted or fostered children. Same-sex couples are nearly three times as likely as their different-sex counterparts to be raising an adopted or foster child. Married same-sex couples are five times more likely to have these children when compared to their married different-sex counterparts. Nearly 27,000 same-sex couples are raising an estimated 58,000 adopted and foster children in the United States. More than 26,000 of those children (46%) are being raised by married same-sex parents.
Key Findings
- Differences in the geographic distribution across regions between same-sex and different-sex couples are most pronounced among married couples. Nearly two-thirds of married same-sex couples (64%) live in the Northeast (33%) and West (31%) compared to just 41% of married different-sex couples. Historically, these are the two parts of the country where marriage for same-sex couples has been more widely available.
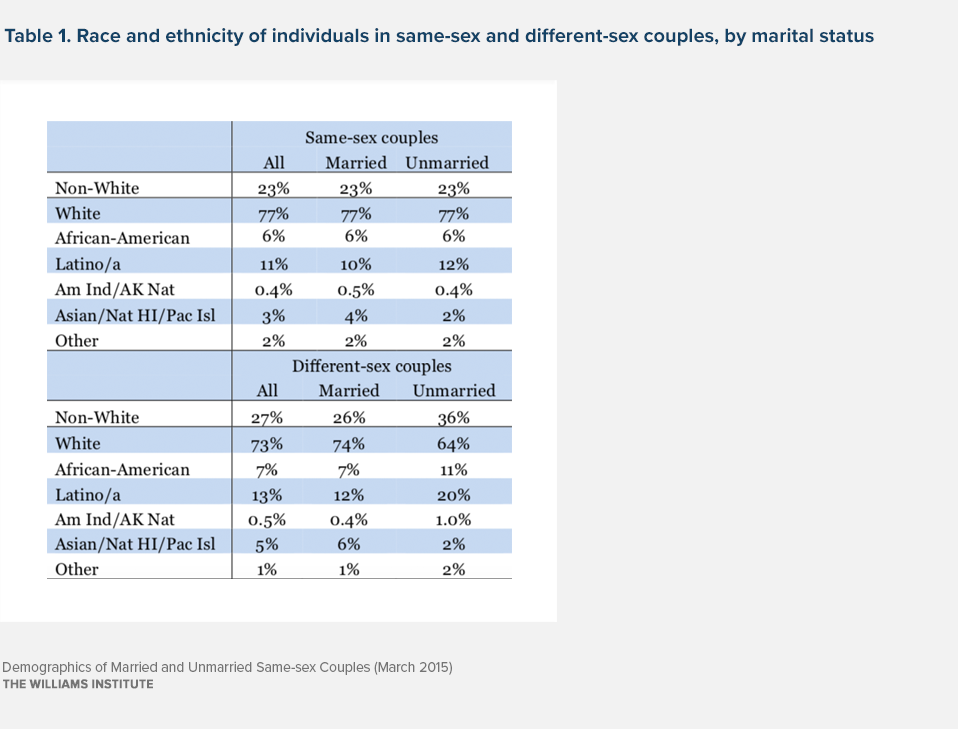
- In total, 23% of individuals in same-sex couples are members of racial or ethnic minorities. This is true for both married and unmarried same-sex couples. By comparison, an estimated 26% of those in married different-sex couples are racial or ethnic minorities compared to 36% in unmarried different-sex couples.
- Homeownership is higher among married couples for both same-sex and different-sex couples. More than 71% of married same-sex couples own their home compared to 65% of unmarried same-sex couples. Among different-sex couples, the difference is 80% versus 41%.
- Married same-sex couples are more likely to have children than their unmarried counterparts. More than a quarter (27%) of married same-sex couples have children under age 18 compared to 15% of unmarried same-sex couples. A third of children being raised by same-sex couples (34%), approximately 71,000, were being raised by a married couple in 2013. In states where same-sex couples could legally marry in that year, more than half of the children being raised by same-sex couples (51%) had married parents.
- More than three-quarters of same-sex couples raising children under age 18 are female (77%). Among married same-sex couples with children, the proportion of female couples is lower at 71%. Female couples comprise 81% of unmarried same-sex couples with children.
- More than a third (35%) of women in same-sex couples who are a racial or ethnic minority are raising a child under age 18 compared to 24% of their White counterparts. For men, the same comparison is 16%versus 6%.
Introduction
Marriage for same-sex couples in the United States has only become widely available in the last year (2014), so data that allows for separate analyses of married and unmarried same-sex couples has been limited. An additional challenge to such analyses has been that prior to the release of the 2013 American Community Survey (ACS) data, the US Census Bureau reported married same-sex couples as “unmarried partners,” making separate analyses of married same-sex couples difficult.
In the 2013 ACS, same-sex couples are treated the same as their different-sex counterparts, so married same-sex couples can be identified. These analyses consider the demographic, economic, and geographic characteristics of married and unmarried same-sex couples, especially those raising children. Comparisons are made with their different-sex counterparts.
Data and methodology
These analyses use the Public Use Microdata Sample (PUMS) from the 2013 American Community Survey. Couple households are defined as such when a householder (Person 1 on the survey form) identifies another individual in the household who is aged 16 or older as his or her “husband/wife” or “unmarried partner.” Respondents also provide information about the sex of the householder and spouse or partner such that same-sex and different-sex couples can be identified.
Prior analyses of same-sex couples using US Census Bureau data have documented difficulties associated with an accurate measurement, particularly of married same-sex couples (Gates and Steinberger, 2009; O’Connell and Feliz, 2011; Cohn, 2014). These difficulties occur when very small portions of surveys from different-sex couple households include miscodes in the sex of the spouses or partners such that they appear to be a same-sex couple. Even small numbers of such miscodes among different-sex couples mean that a relatively large portion of the same-sex couple sample includes miscoded different-sex couples. Since nearly 90% of different-sex couples are married, the accuracy of the married same-sex couple sample has been shown to be more compromised.
These analyses make several adjustments to the data to improve the likelihood that observed same-sex couples, particularly married same-sex couples, are not different-sex couples miscoded as same-sex couples. These adjustments remove responses from the sample that are most likely to be comprised of miscoded different-sex couples. Several of the adjustments remove households where responses to key variables used to determine if a couple is same-sex or different-sex and if a couple is married or not have been “allocated.” Census Bureau procedures allocate a variable if the original response was missing or there was an anomaly in the response. In those cases, statistical procedures are used to assign the most likely accurate response.
The adjustment procedure for these analyses removes responses from the analytical sample if:
- The sex of a partner or spouse in a same-sex or different-sex couple is allocated.
- The marital status of a partner or spouse in a same-sex or different-sex couple is allocated.
- Spouses in same-sex and different-sex couples report being currently married but record different years when the marriage occurred.
- Spouses in same-sex couples report that their marriage occurred prior to 2004, when Massachusetts became the first state to permit same-sex couples to marry.
It is possible that the adjustment procedure removes a small number of valid same-sex couples who report being married prior to 2004. Same-sex couples have been able to legally marry in some countries outside of the US since 2001. Further, some couples who had civil unions, registered domestic partnerships, or commitment ceremonies could report the dates of those occasions (regardless of when a legal marriage actually occurred) as some of those statuses automatically converted to marriage or couples just view those dates as more significant than the date of a legal marriage.
The 2013 ACS PUMS includes 617,090 married different-sex couple households and 8,340 same-sex couple households, of which 3,102 are married and 5,238 are unmarried. The adjustment procedure removes 48,506 married different-sex households from the analyses (nearly 8%). It removes 2,346 same-sex couple households (married and unmarried), accounting for 28% of the original sample. This is consistent with prior estimates of the portion of same-sex couples that are likely miscoded different-sex couples (Gates and Steinberger, 2009; O’Connell and Feliz, 2011). Also consistent with prior analyses of the accuracy of same-sex couple samples in Census Bureau data, the adjustment results in proportionally more observations being removed among married same-sex couples (55%) than among unmarried same-sex couple households (12%).
Demographics of married and unmarried couples
Analyses of the 2013 National Health Interview Survey (NHIS) indicate that in the United States there are approximately 690,000 same-sex couples (including both married and unmarried couples), meaning that nearly 1.4 million Americans are members of a same-sex couple. The NHIS analyses suggested that an estimated 130,000 same-sex couples (19%) were married (Gates 2014).
Because of the challenges associated with accurate measurement of same-sex couples in the ACS and the necessity of adjusting samples to improve the validity of the same-sex couple sample, it is difficult to use the ACS PUMS data to provide accurate estimates of the number of married and unmarried same-sex couples. However, similar to the findings from the 2013 NHIS, the adjusted ACS data suggest that an estimated 21% of same-sex couples were married.
Geography
Analyses from Census 2010 showed that same-sex couples were present in 93% of counties in the US (Gates and Cooke 2011). The 2013 ACS data show that same-sex couples are present in all regions of the country. However, the distribution of same-sex couples across those regions is somewhat different from the distribution of different-sex couples.
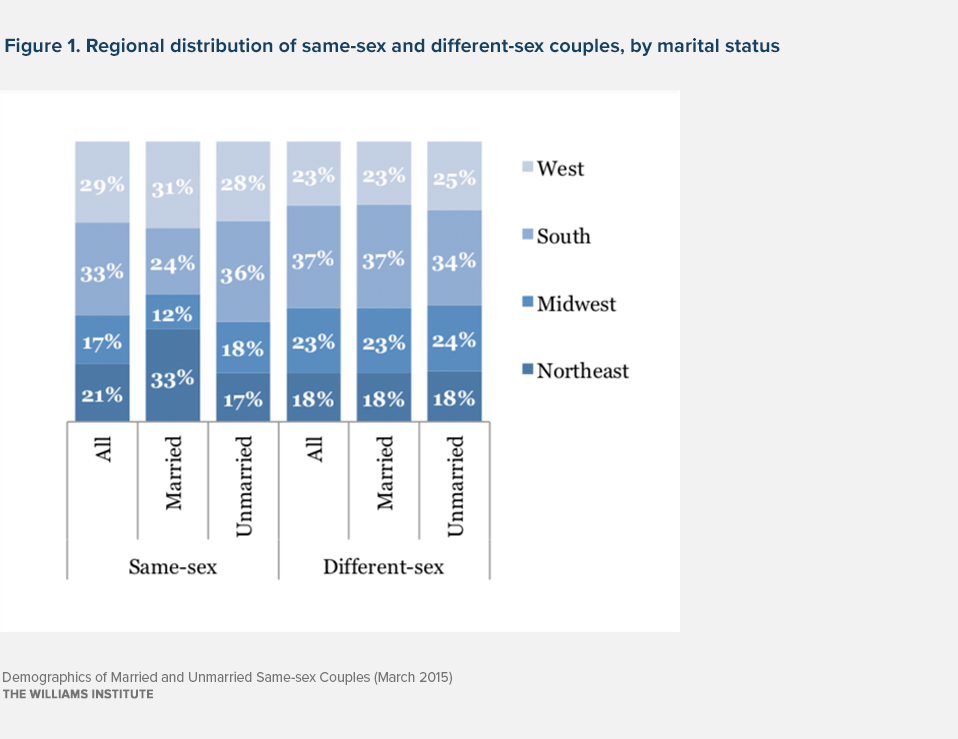
Compared to different-sex couples, same-sex couples are somewhat more likely to live in the Northeast and West and less likely to live in the South and Midwest (see Figure 1). The differences could be related to two factors. First, same-sex couples may be more likely than their different-sex counterparts to factor in social and legal acceptance toward same-sex couples and LGBT people more generally in decisions about where to live. The social and legal climate for LGBT people is generally more supportive in the Northeast and West, perhaps meaning that disproportionate numbers of same-sex couples have located there. The differential willingness among same-sex couples to report themselves as such that is related to social and legal acceptance could be a second factor that explains the geographic patterns. It may be that greater acceptance in the Northeast and West results in proportionately more same-sex couples in those regions being willing to identify as such.
Not surprisingly, the differences in geographic distribution across regions between same-sex and different-sex couples are most pronounced among married couples. Nearly two-thirds of married same-sex couples (64%) live in the Northeast (33%) and West (31%) compared to just 41% of married different-sex couples. These are the two regions of the country where marriage for same-sex couples has been more widely available. These estimates imply that in 2013, 34% of same-sex couples in the Northeast were married, as were 23% in the West, 16% in the Midwest and 15% in the South.
Sex, Age, and Race/Ethnicity
A small majority of same-sex couples (married and unmarried) are female (51%), although a higher proportion of married same-sex couples is female (53%) compared to unmarried same-sex couples (50%).
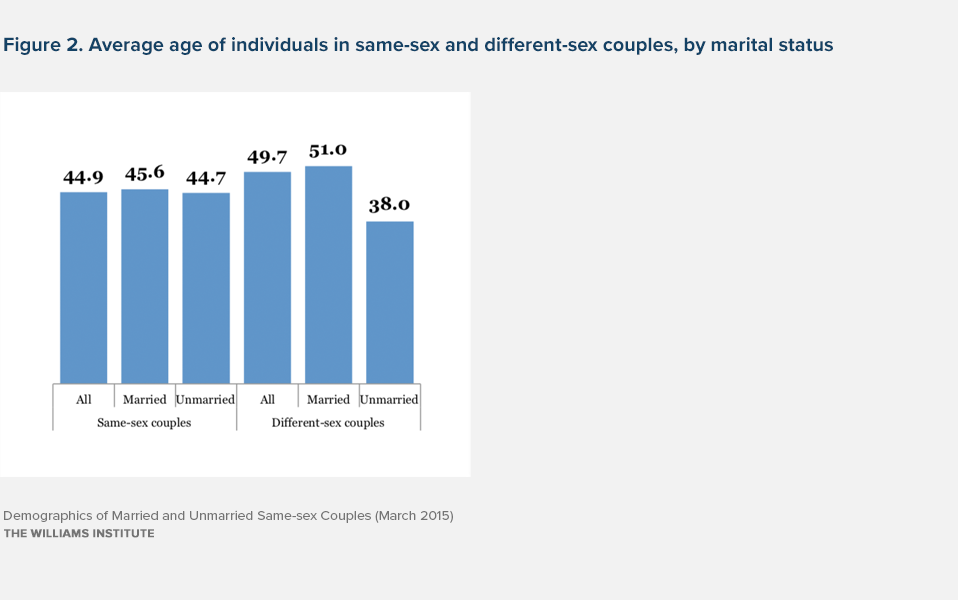
The average age of individuals in same-sex couples (married and unmarried) in the United States is nearly five years younger than that of individuals in different-sex couples: 44.8 and 49.7 years old, respectively (see Figure 2). Those in married couples (both same-sex and different-sex) are older than their unmarried counterparts, but the age gap is much wider among different-sex couples than among same-sex couples. Individuals in married different-sex couples are, on average, 13 years older than their unmarried counterparts. The difference is less than a year among those in same-sex couples.
The racial and ethnic distributions of individuals in same-sex and different-sex married couples are similar. In total, 23% of individuals in same-sex couples are members of racial or ethnic minorities. This is true for both married and unmarried same-sex couples (see Table 1).
While 27% of individuals in different-sex couples are racial or ethnic minorities, there are substantial differences by marital status. An estimated 26% of those in married different-sex couples are racial or ethnic minorities compared to 36% in unmarried different-sex couples.|
The proportions of same-sex couples (married and unmarried) within specific racial and ethnic groups are very similar to those among married different-sex couples, as well as all different-sex couples.
Socio-Economic Status
Substantial research suggests that marriage is associated with lower levels of economic vulnerability in couples and families (e.g., Becker, 1981; Waite & Gallagher, 2001; Lerman, 2002). Even though the availability of marriage for same-sex couples is relatively recent for most couples in the United States, economic advantages associated with marriage are evident among same-sex couples in ways that are similar to their different-sex counterparts.
Married same-sex couples have a median household income that is approximately 27% higher than the median income of unmarried same-sex couples (see Table 2). By comparison, married different-sex couples have a median household income that exceeds that of their unmarried counterparts by 46%.
Poverty is substantially less common among married same-sex couples (4%) than among unmarried same-sex couples (18%). The comparable poverty gap is even wider among different-sex couples at 6% and 30%, respectively.
Homeownership is higher among married couples for both same-sex and different-sex couples. More than 71% of married same-sex couples own their home compared to 65% of unmarried same-sex couples. Among different-sex couples, the difference is 80% versus 41%.
Demographics of married and unmarried couples raising children
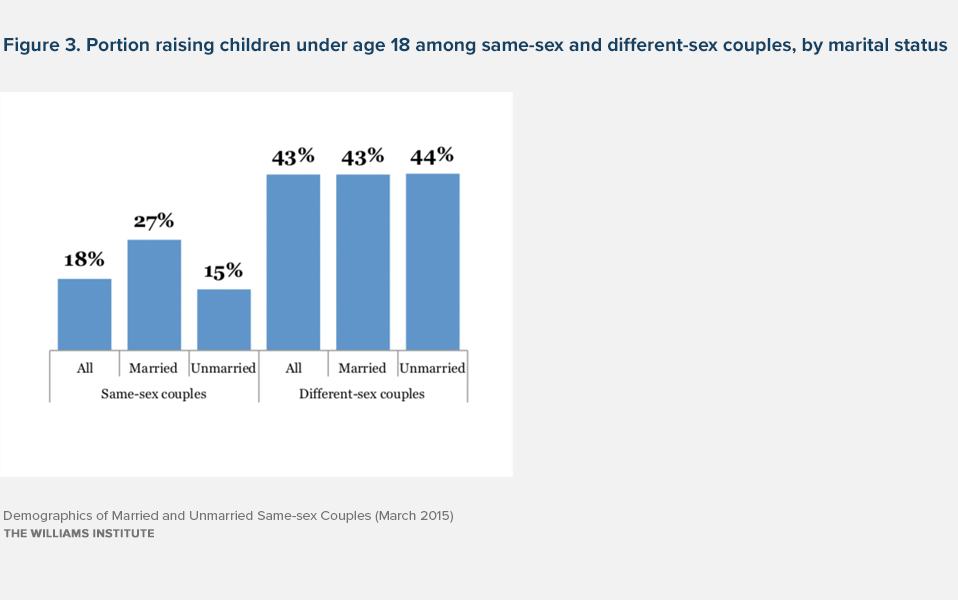
Almost one in five same-sex couples (18%) are raising children under age 18 compared to 43% of different-sex couples. Same-sex couples raising children have, on average, 1.7 children in their home. Assuming that there are approximately 690,000 same-sex couples in the US, this implies that nearly 122,000 same-sex-couple households include almost 210,000 children under age 18 in their homes.
Married same-sex couples are more likely to have children than their unmarried counterparts. More than a quarter (27%) of married same-sex couples have children under age 18 compared to 15% of unmarried same-sex couples. The portion of couples raising children does not vary much by marital status among different-sex couples (see Figure 3).
A third of children being raised by same-sex couples (34%), approximately 71,000, were being raised by a married same-sex couple. In states where same-sex couples could legally marry in 2013, more than half of the children being raised by same-sex couples (51%) had married parents.
In the debates about the effects of allowing same-sex couples to marry, the issue of whether allowing same-sex couples to marry might reduce the likelihood that children will be raised by married different-sex parents has been raised. In 2013, the portion of all children under age 18 being raised by married different-sex parents in the United States was slightly higher in states where same-sex couples could legally marry (65%) than in those where marriage was restricted to different-sex couples (64%). The average number of children under age 18 that different-sex married couples with children are raising is the same (1.9), regardless of the availability of marriage for same-sex couples.
Geography
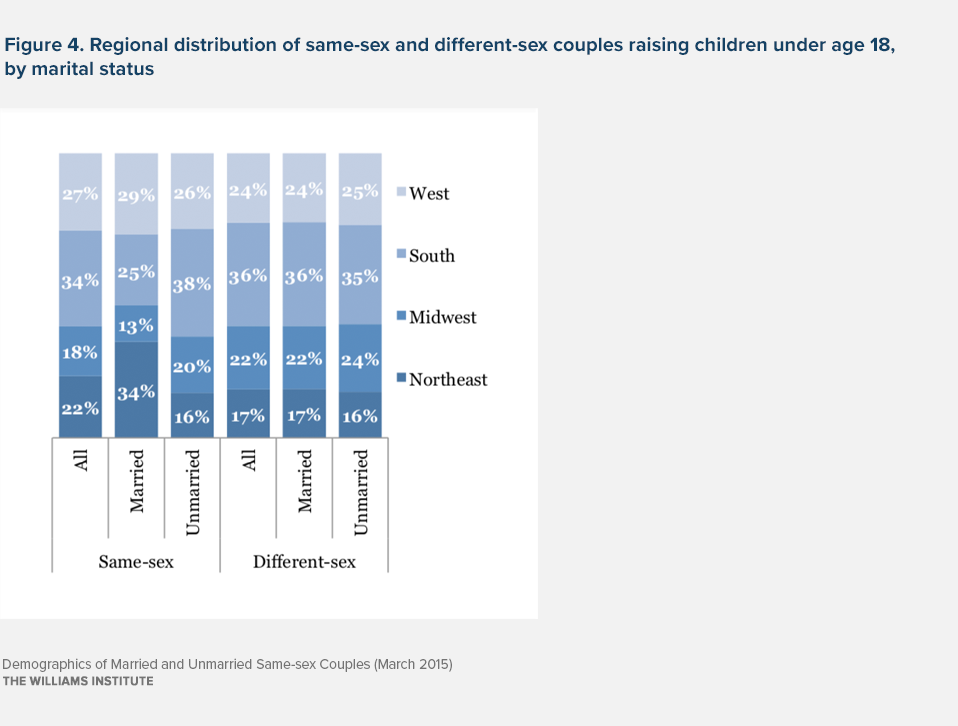
Like differences observed among all couples, same-sex couples raising children under age 18 are more likely than their different-sex counterparts to live in the Northeast and West, but the differences are not as large among couples with children (see Figure 4).
The portion of same-sex couples raising children under age 18 does not vary very much across regions. An estimated 18% of same-sex couples are raising children in the Northeast, Midwest, and in the South. In the West, the figure is 17%.
Likely due to the availability of marriage for same-sex couples, same-sex couples with children are much more likely than their different-sex counterparts to live in the Northeast (34% and 17%, respectively) and West (29% and 24%, respectively).
Among married same-sex couples, 29% of those in the South are raising children compared to 28% in the Northeast and Midwest and 25% in the West. Among unmarried same-sex couples, 16% are raising children in the Midwest and South compared to 14% in the Northeast and West.
Sex, Age, and Race/Ethnicity
More than three-quarters of same-sex couples raising children under age 18 are female (77%). Among married same-sex couples with children, the proportion female is lower at 71%. Female couples comprise 81% of unmarried same-sex couples with children.
Among all same-sex couples, 27% of female couples and 8% of male couples are raising children under age 18. Among married same-sex couples, 36% of female couples and 17% of male couples are raising children. The difference among unmarried same-sex couples is 24% and 6%, respectively.
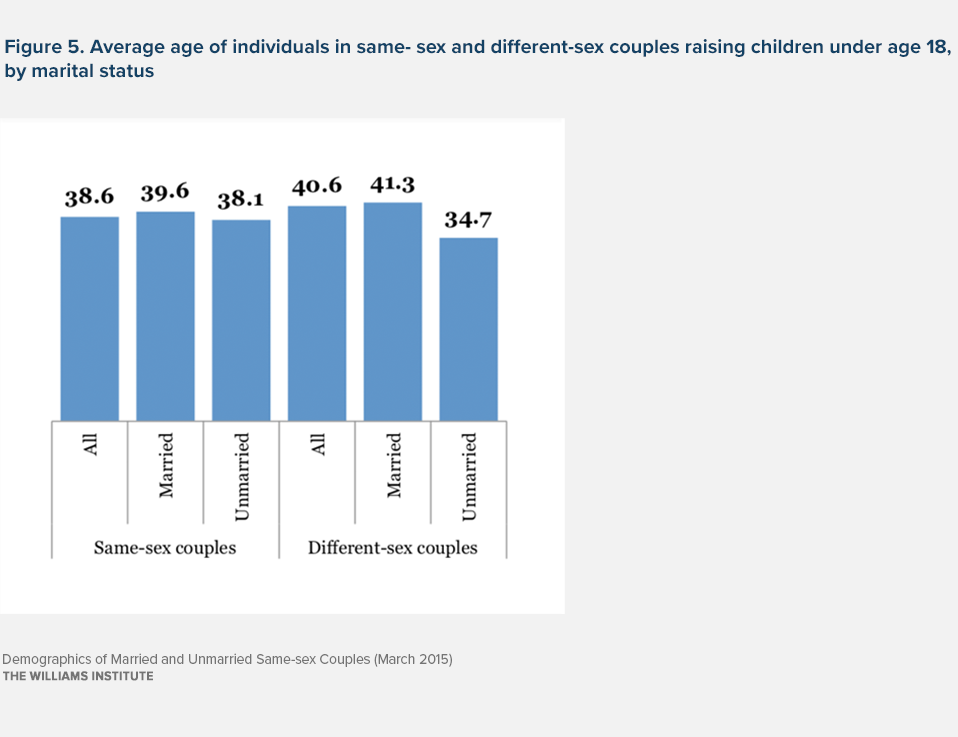
Individuals in same-sex couples raising children are, on average, nearly 3 years younger than their different-sex counterparts. Among married couples, the gap is only 1.7 years. Individuals in same-sex unmarried couples with children are, on average, 3.4 years older than their counterparts in different-sex couples (see Figure 5).
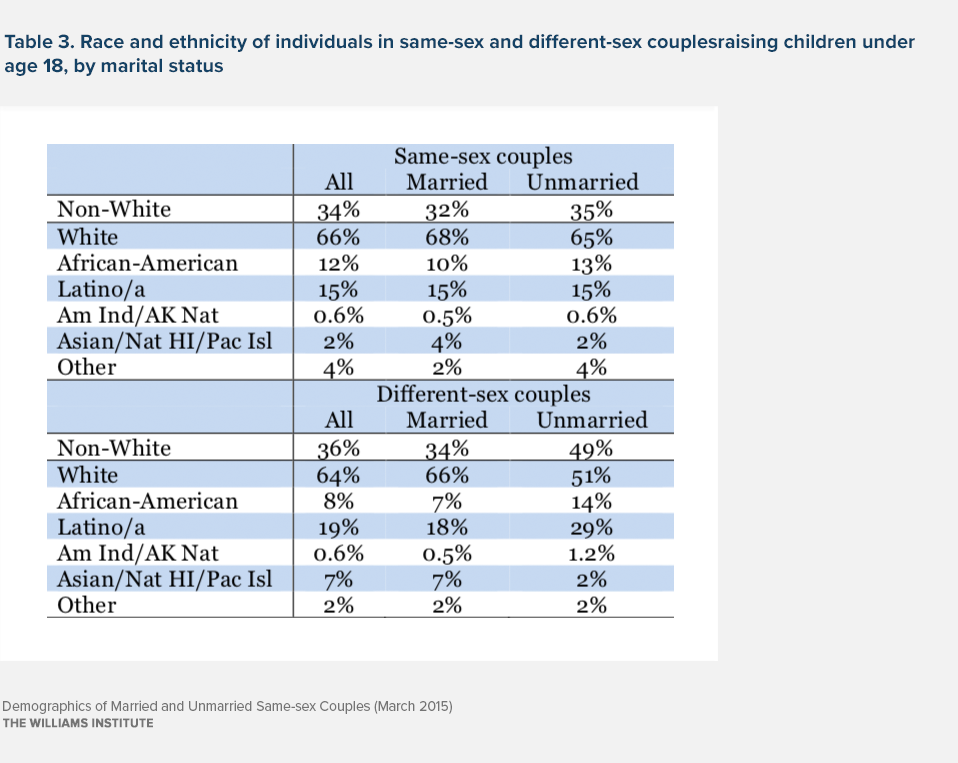
Like different-sex couples, parenting by individuals in same-sex couples is more prevalent among racial and ethnic minorities. More than a third (34%) of those in same-sex couples raising children are racial or ethnic minorities. Among those in married same-sex couples raising children, 32% are racial or ethnic minorities compared to 35% among those in unmarried same-sex couples with children (see Table 3).
Most racial and ethnic minorities in same-sex couples who are raising children are African-American (12%) or Latino/a (15%). Among different-sex couples raising children, 8% are African-American and 19% are Latino/a.
More than a third (35%) of racial or ethnic minority women in same-sex couples are raising children under age 18 compared to 24% of their White counterparts. For men, the same comparison is 16% versus 6%, respectively.
Socio-Economic Status
Same-sex couples with children evidence relatively high levels of economic vulnerability when compared to their different-sex counterparts, but this is largely due to economic vulnerability among unmarried same-sex couples.
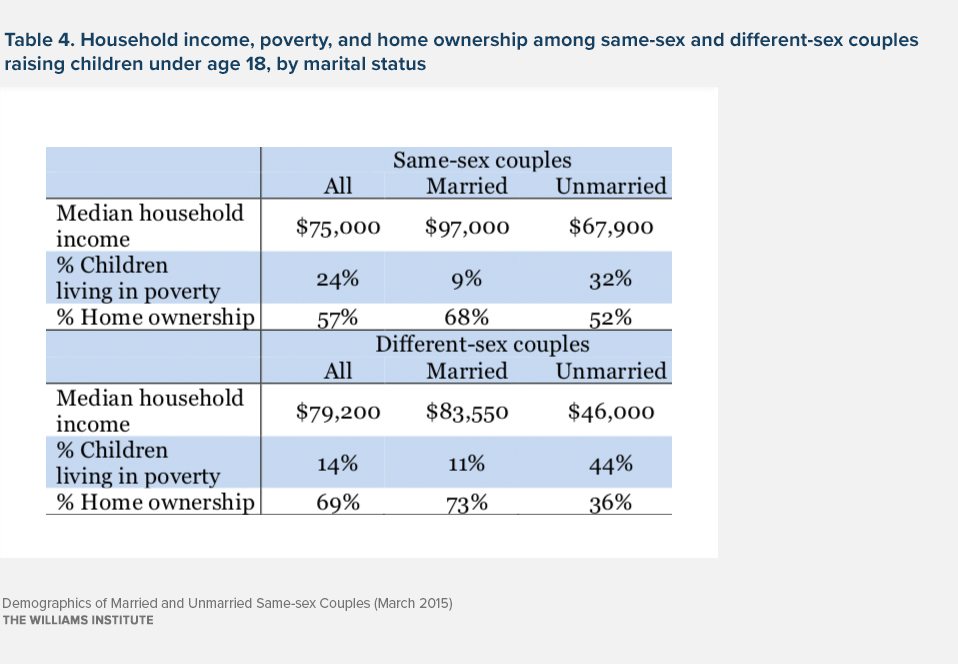
The median annual household income of same-sex couples (married and unmarried) with children under age 18 in the home is more than 5% lower than the median annual household income of different-sex couples with children ($75,000 versus $79,220), and 10% lower than the median annual income of married different-sex couples with children ($83,550). However, married same-sex couples with children have a much higher median annual household income of $97,000, which exceeds that of married different-sex couples with children by 16%. Unmarried same-sex couples with children also have a higher median household income than unmarried different-sex couples with children.
Poverty rates among children under age 18 being raised by same-sex couples also evidence economic disadvantage. Nearly one in five children being raised by same-sex couples (24%) live in poverty compared to 14% of children being raised by different-sex parents. However, only 9% of children being raised by married same-sex couples live in poverty compared to 11% of children raised by married different-sex couples. Poverty rates for children raised by unmarried couples are very high: 32% among those in same-sex couples and 44% among those in different-sex couples.
Homeownership is higher among different-sex couples with children (69%) than among same-sex couples with children (57%). But that gap narrows among married couples with children to 73% and 68%, respectively.
Same-sex couples with children evidence overall economic disadvantage when compared to their different-sex counterparts. This is partly because same-sex parents are more likely to be female and are younger than different-sex parents. Women and younger people experience increased economic vulnerability.
But among both married and unmarried couples with children, same-sex couples are not disadvantaged. This is because a much bigger proportion of different-sex couples with children are married (89%) compared to comparable same-sex couples (33%).
Adoption and Fostering
The ACS data do not allow for a full assessment of the nature of relationships between parents and children in couples. Instead, the data provide information about how the householder (the person who completed the survey) is related to other members of the household, including all children under age 18 in the home.
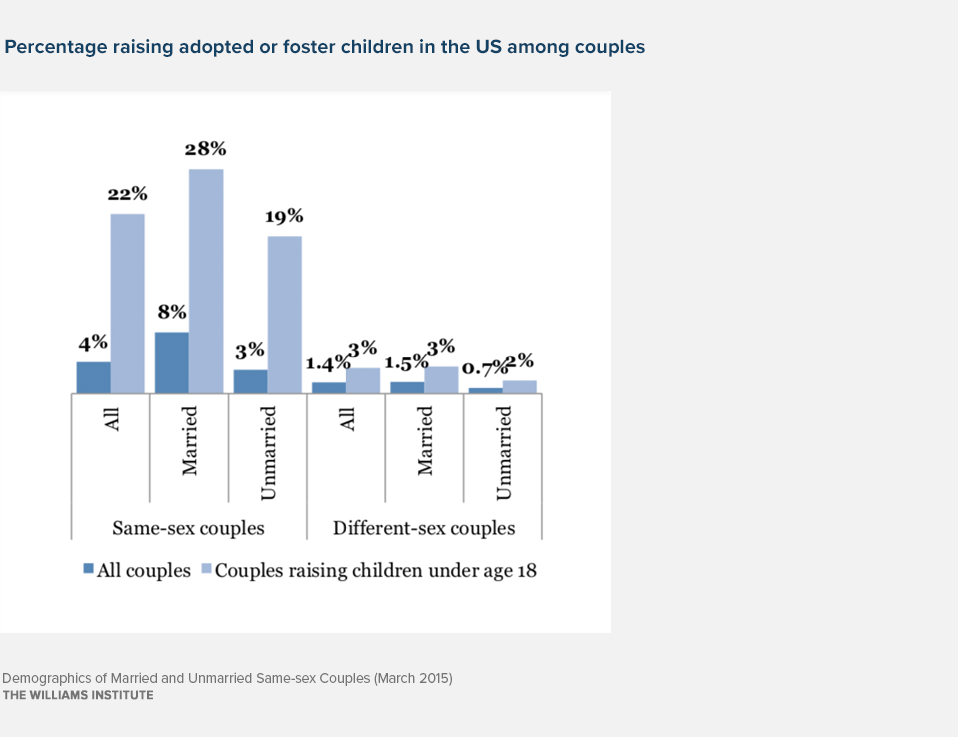
Even though same-sex couples are less likely to be raising children than are different-sex couples, they are much more likely to have adopted or fostered children. Nationally, same-sex couples are nearly three times as likely as their different-sex counterparts to be raising an adopted or foster child. Approximately 4% of same-sex couples have an adopted or foster child under age 18 compared to 1.4% of different-sex couples. Among married same-sex couples, 8% have an adopted or foster child, making them five times more likely to have these children than their different-sex counterparts (see Figure 6).

These figures imply that nearly 27,000 same-sex couples are raising an estimated 58,000 adopted and foster children in the United States. As of 2013, more than 26,000 of those children (46%) were being raised by married same-sex parents.
The differences in adoption and fostering among same-sex and married different-sex couples are even greater when comparing couples with children under age 18. Nationally, among couples with children in the home, 22% of same-sex couples have an adopted or foster child compared to just 3% of different-sex couples. Nearly three in ten married same-sex couples with children (28%) are raising an adopted or foster child.
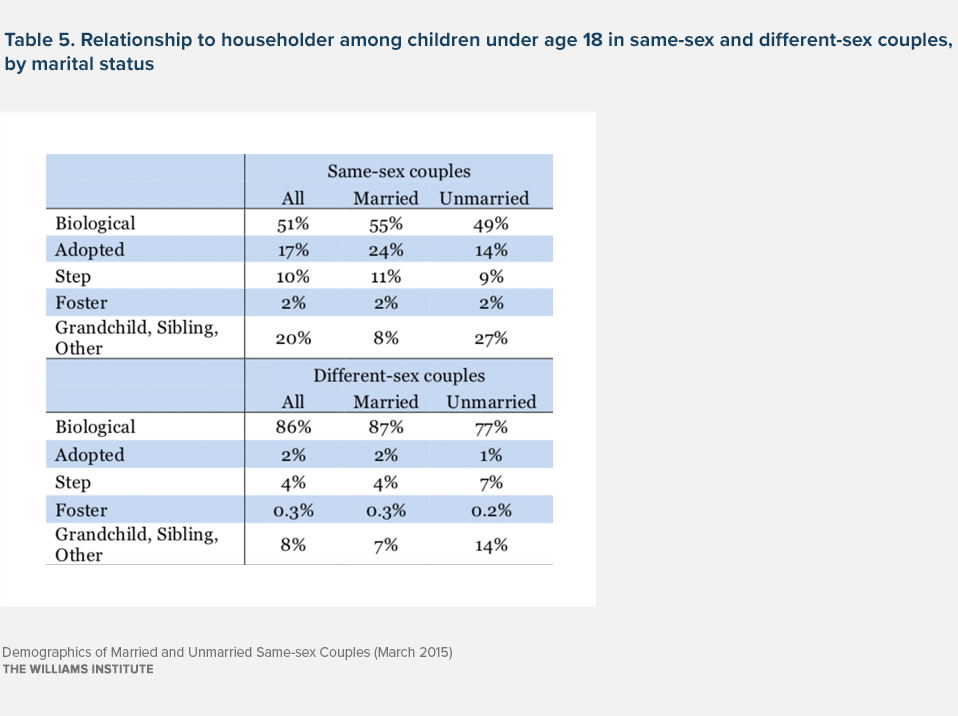
While a relatively large proportion of same-sex couples, particularly married couples, are raising adopted or foster children, most of their children (61%) are likely biologically related to one of their parents. More than half of the children being raised by same-sex couples are identified as the biological (51%) or step-child (10%) of one parent (see Table 5). Among different-sex couples, approximately 9 in 10 children are biological or stepchildren, and only about 2% are adopted or foster children.
More than one in four children under age 18 being raised by married same-sex couples (26%) are adopted or foster children. An estimated 16% of children being raised by unmarried same-sex couples are adopted or foster children.
Like their different-sex counterparts, married same-sex couples are less likely to have grandchildren, siblings, or other children in the home (8%) when compared to their unmarried counterparts (27%). Among different-sex couples, the comparable difference is 7% versus 14%.