Overview
Gender identities that fall outside of the man-woman binary are represented in the scientific and popular literatures, using terms such as nonbinary, gender fluid, and genderqueer. Just as both transgender and cisgender people use binary identities (i.e., man, woman), both transgender and cisgender people use nonbinary gender identities. Researchers have found that there are key differences between binary and nonbinary identified transgender people that are relevant to understanding health and well-being, such as higher rates of depression but lower rates of mental health care usage among nonbinary people. Far less is known about people who identify with a nonbinary identity who are not transgender. This research brief provides demographics and descriptive statistics on the economic status and health of transgender and cisgender nonbinary LGBTQ adults ages 18-60 years old. See, Methods Note for information about the sampling design and the studies from which these data originate.
Findings
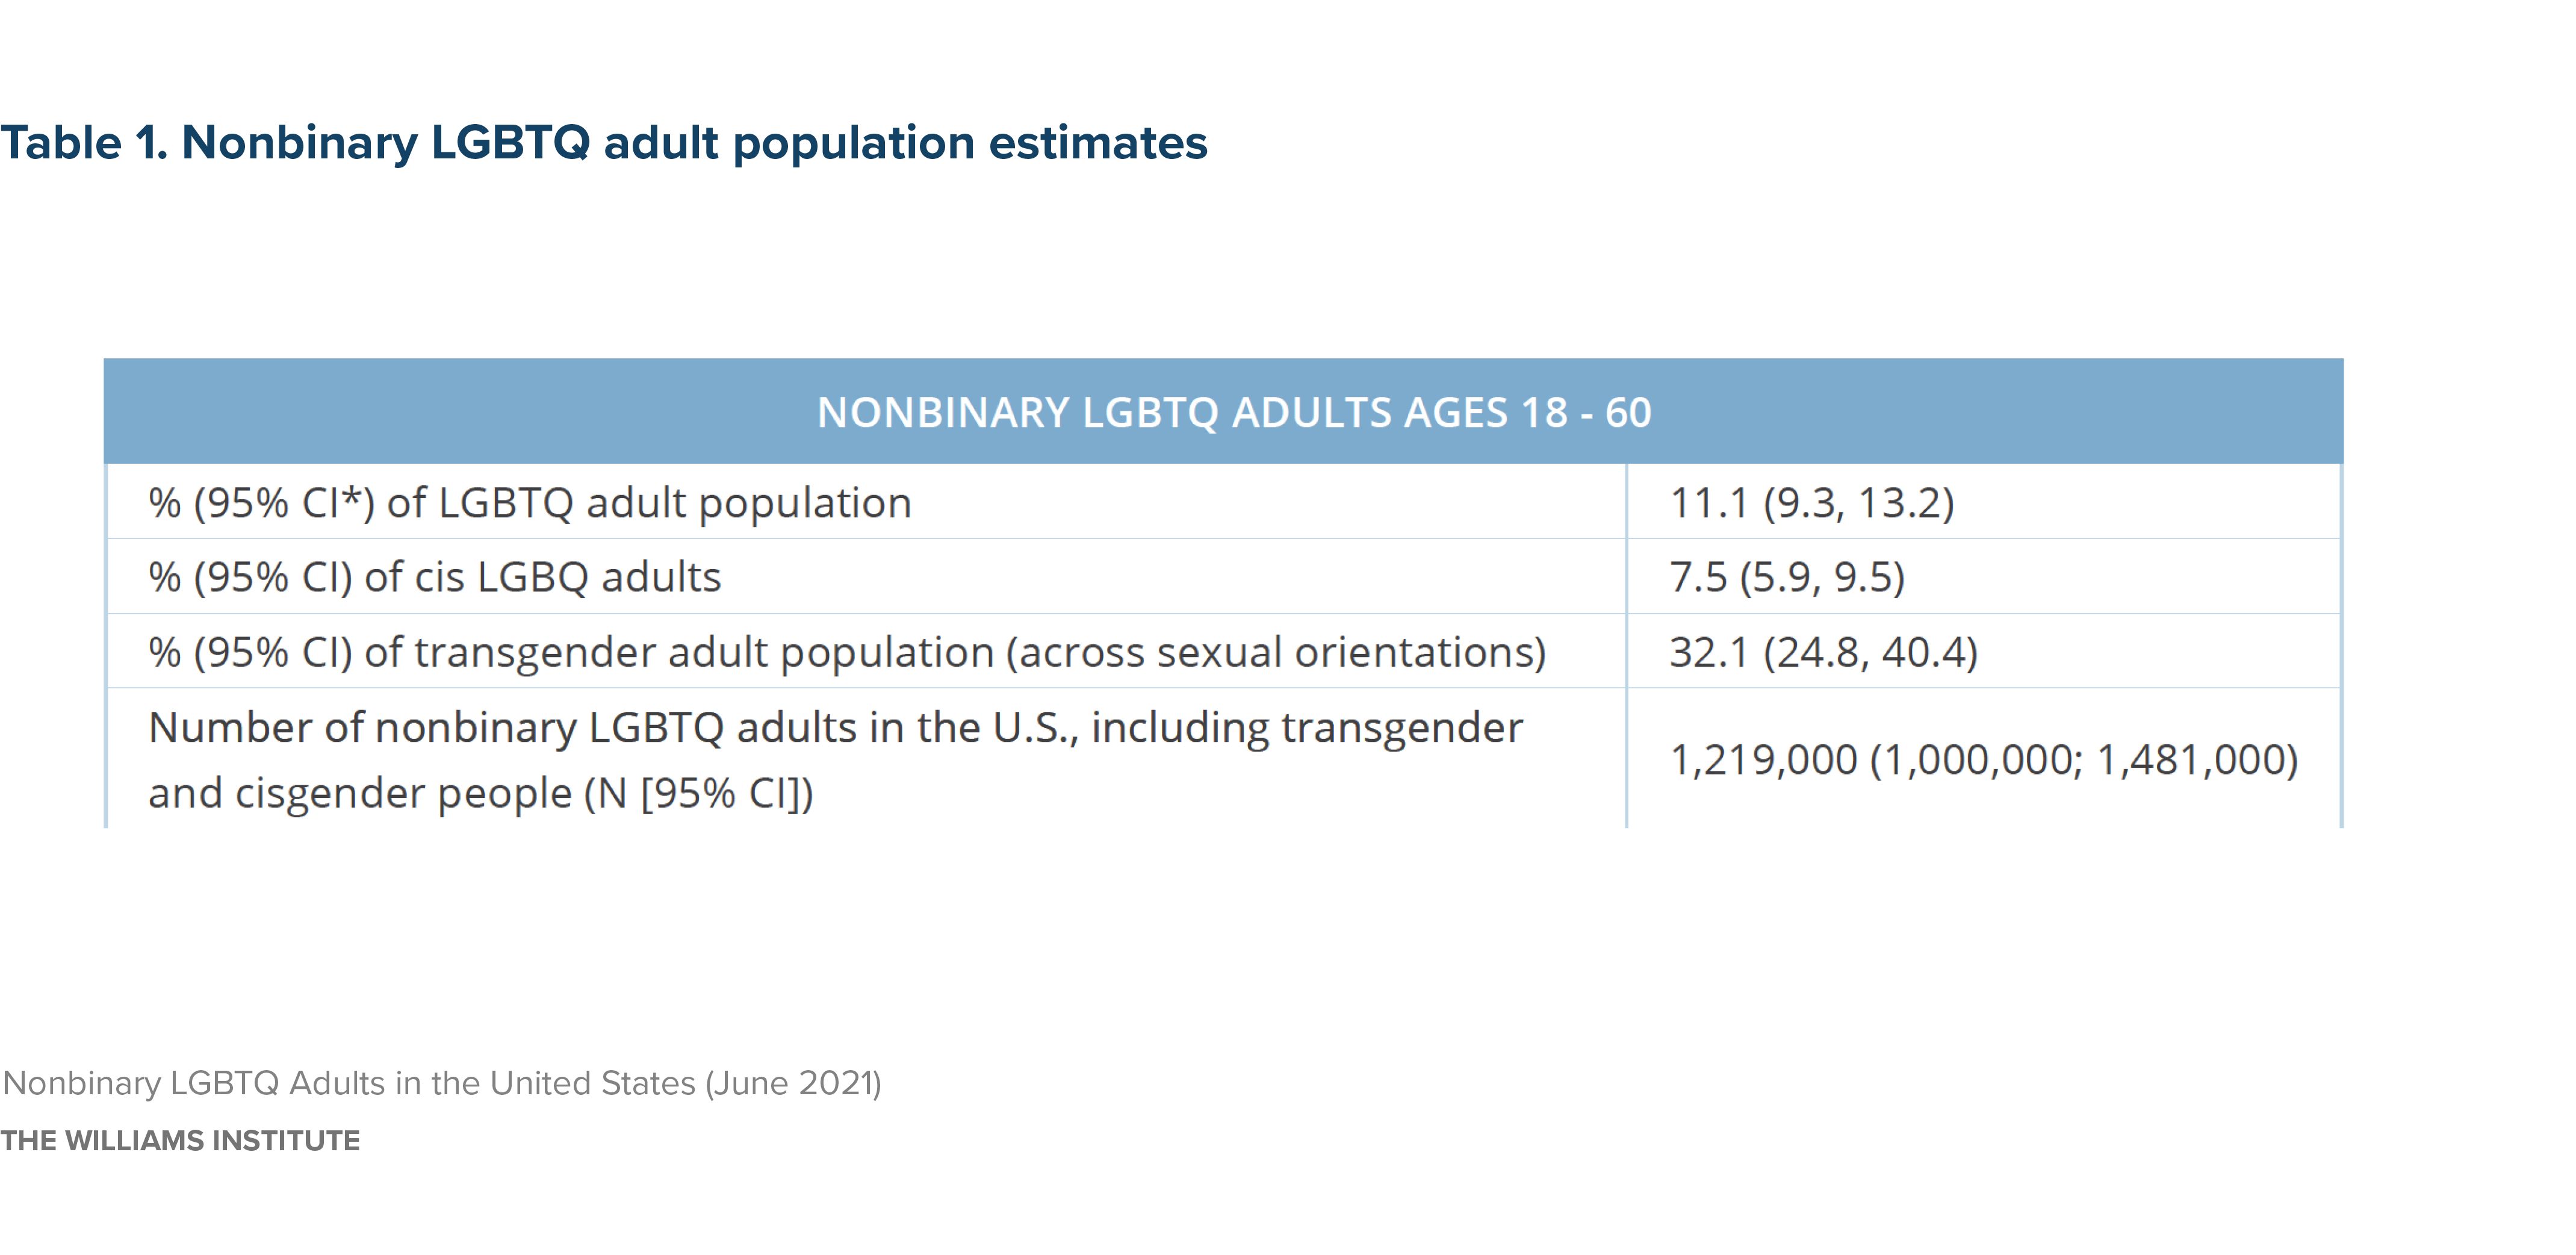
About 11% of the LGBTQ adults (age 18-60 years) identify as nonbinary in terms of their gender. While nonbinary-identified people are among both cisgender and transgender LGBTQ populations, they make up a larger proportion of the transgender population than of the cisgender LGBQ adult population (Table 1).
Characteristics of Nonbinary People
The majority of nonbinary LGBTQ adults are young, urban, and born in the U.S. In terms of race/ethnicity identity (Table A.1), respondents identified as White (58%) multiracial (16%), Latinx (15%), and Black (9%). Due to recruitment strategy for the Generations study, American Indian/Native Alaskan and Asian/Pacific Islanders are under-represented in this report (see Methods Note). Nonbinary LGBTQ adults live in all regions of the U.S., though they are slightly less likely to live in the Midwest (16%) than in the Northeast (25%), South (27%), and West (31%).
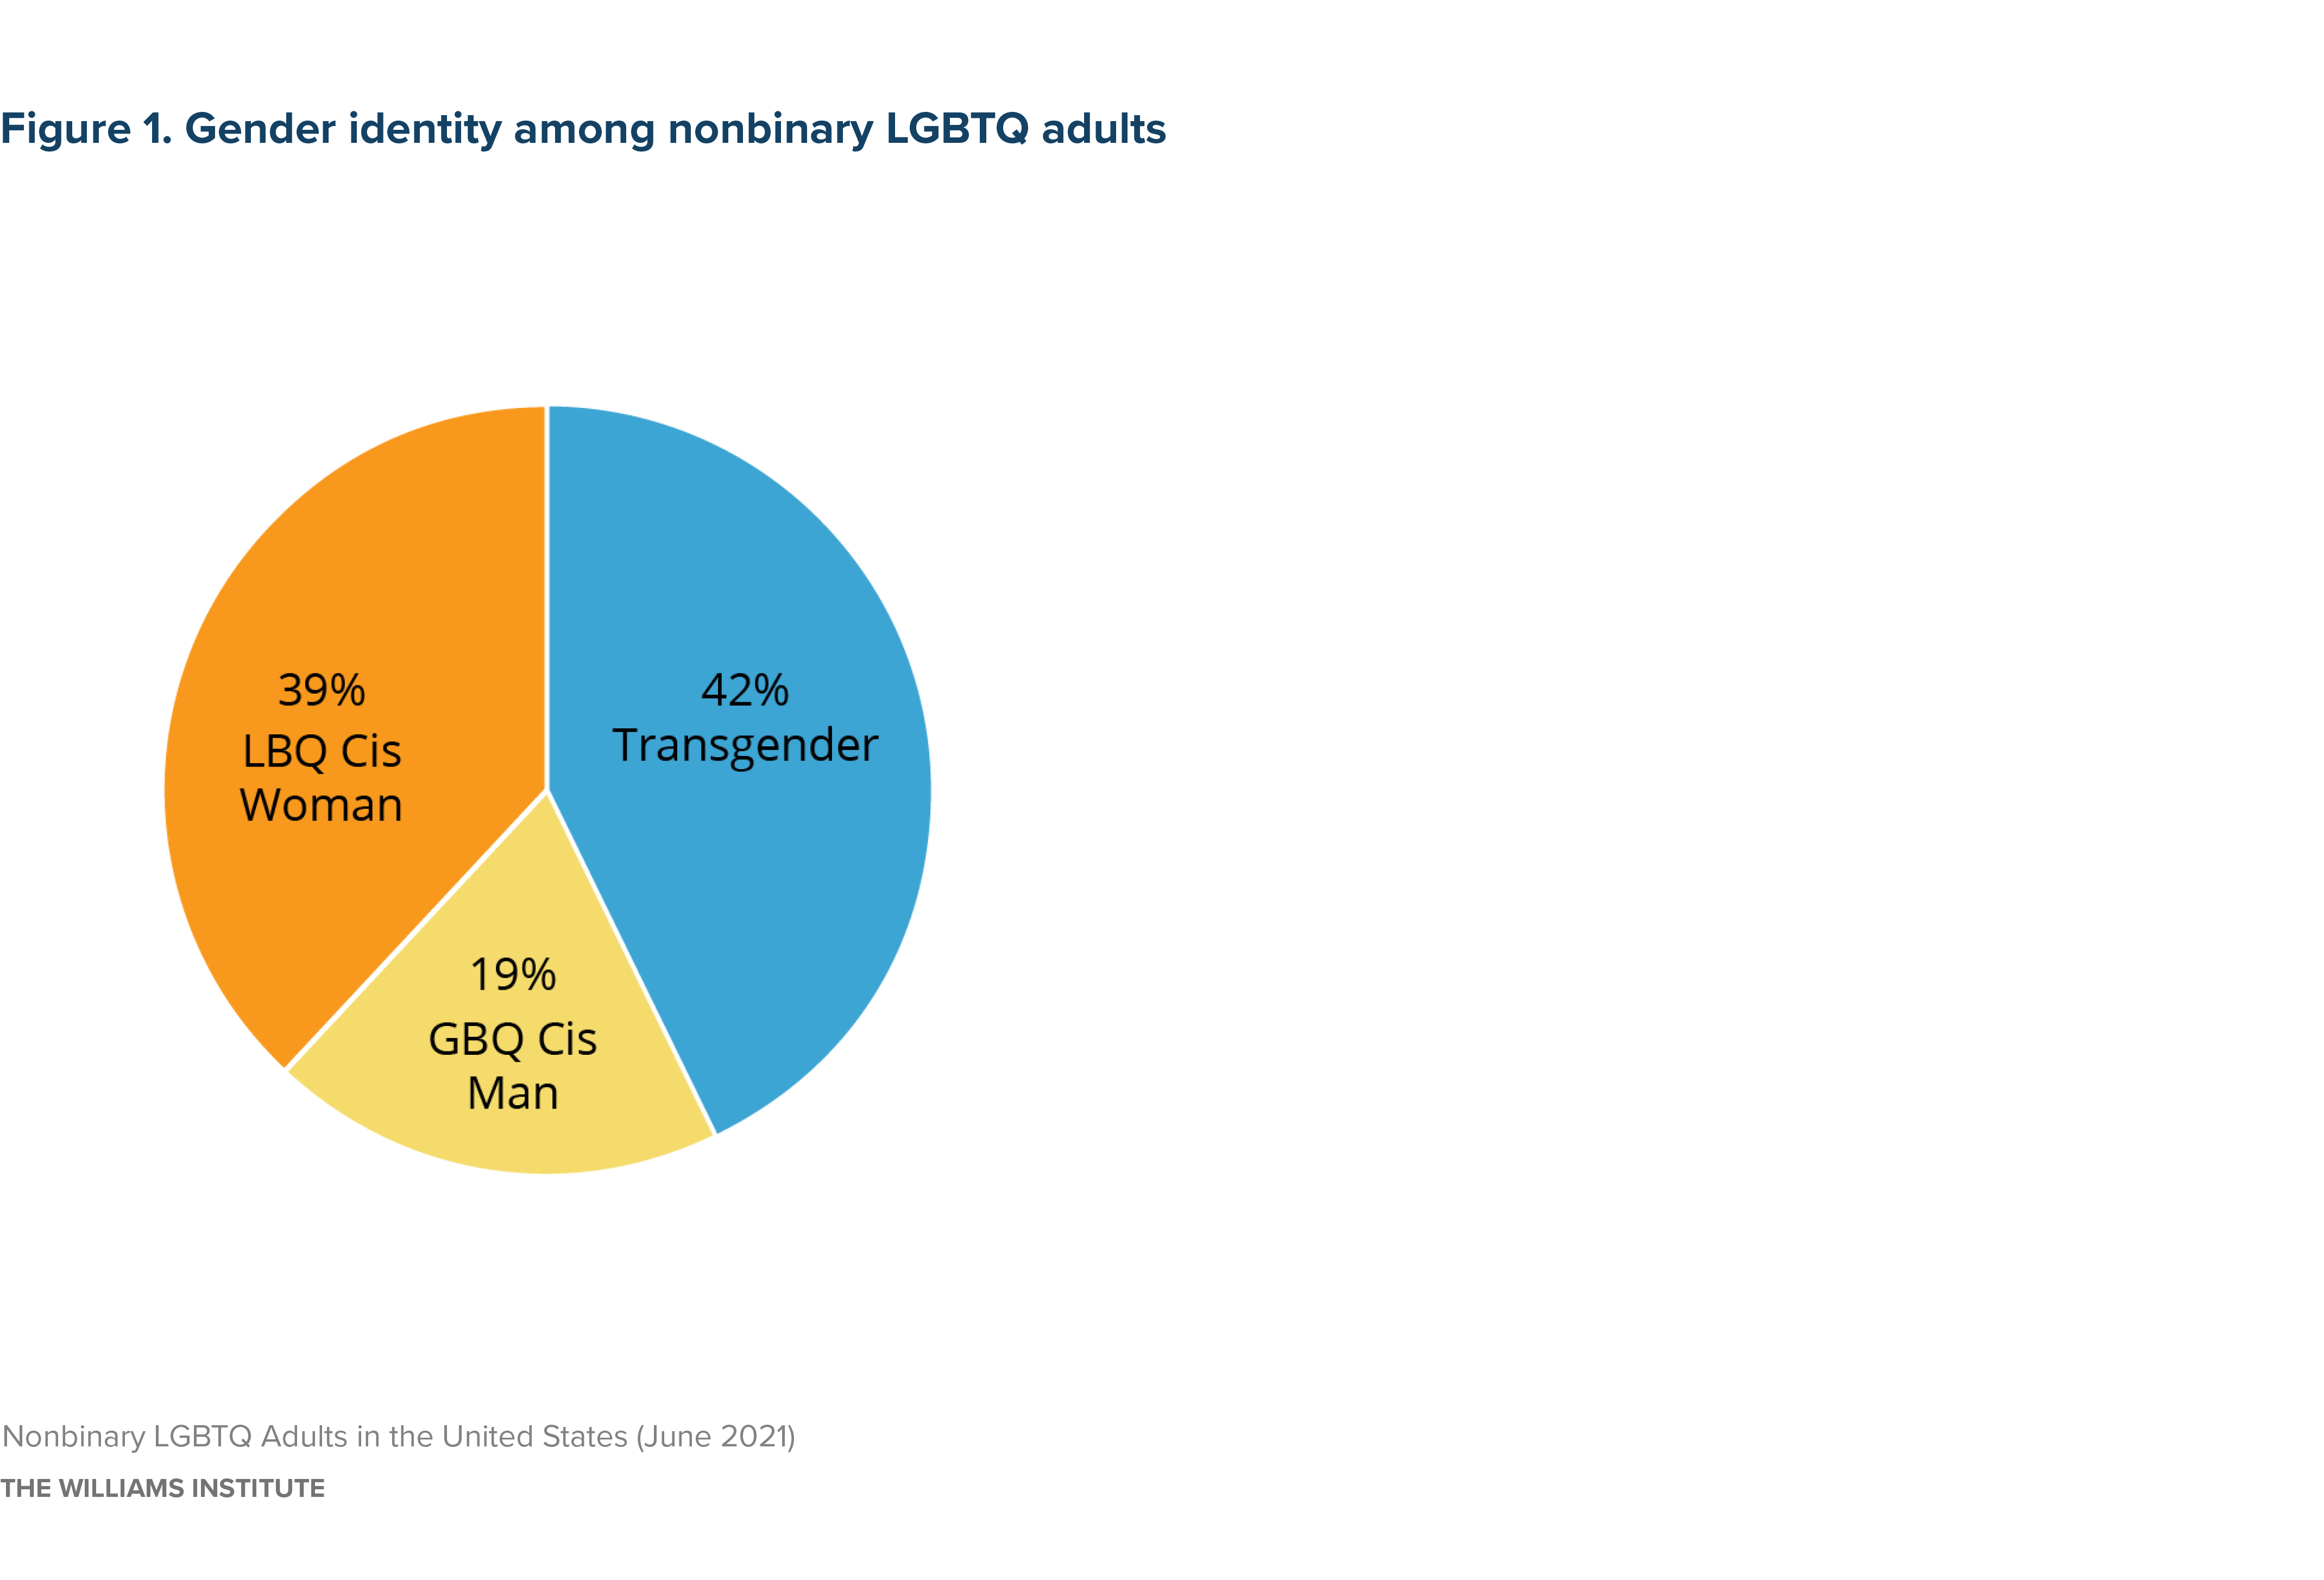
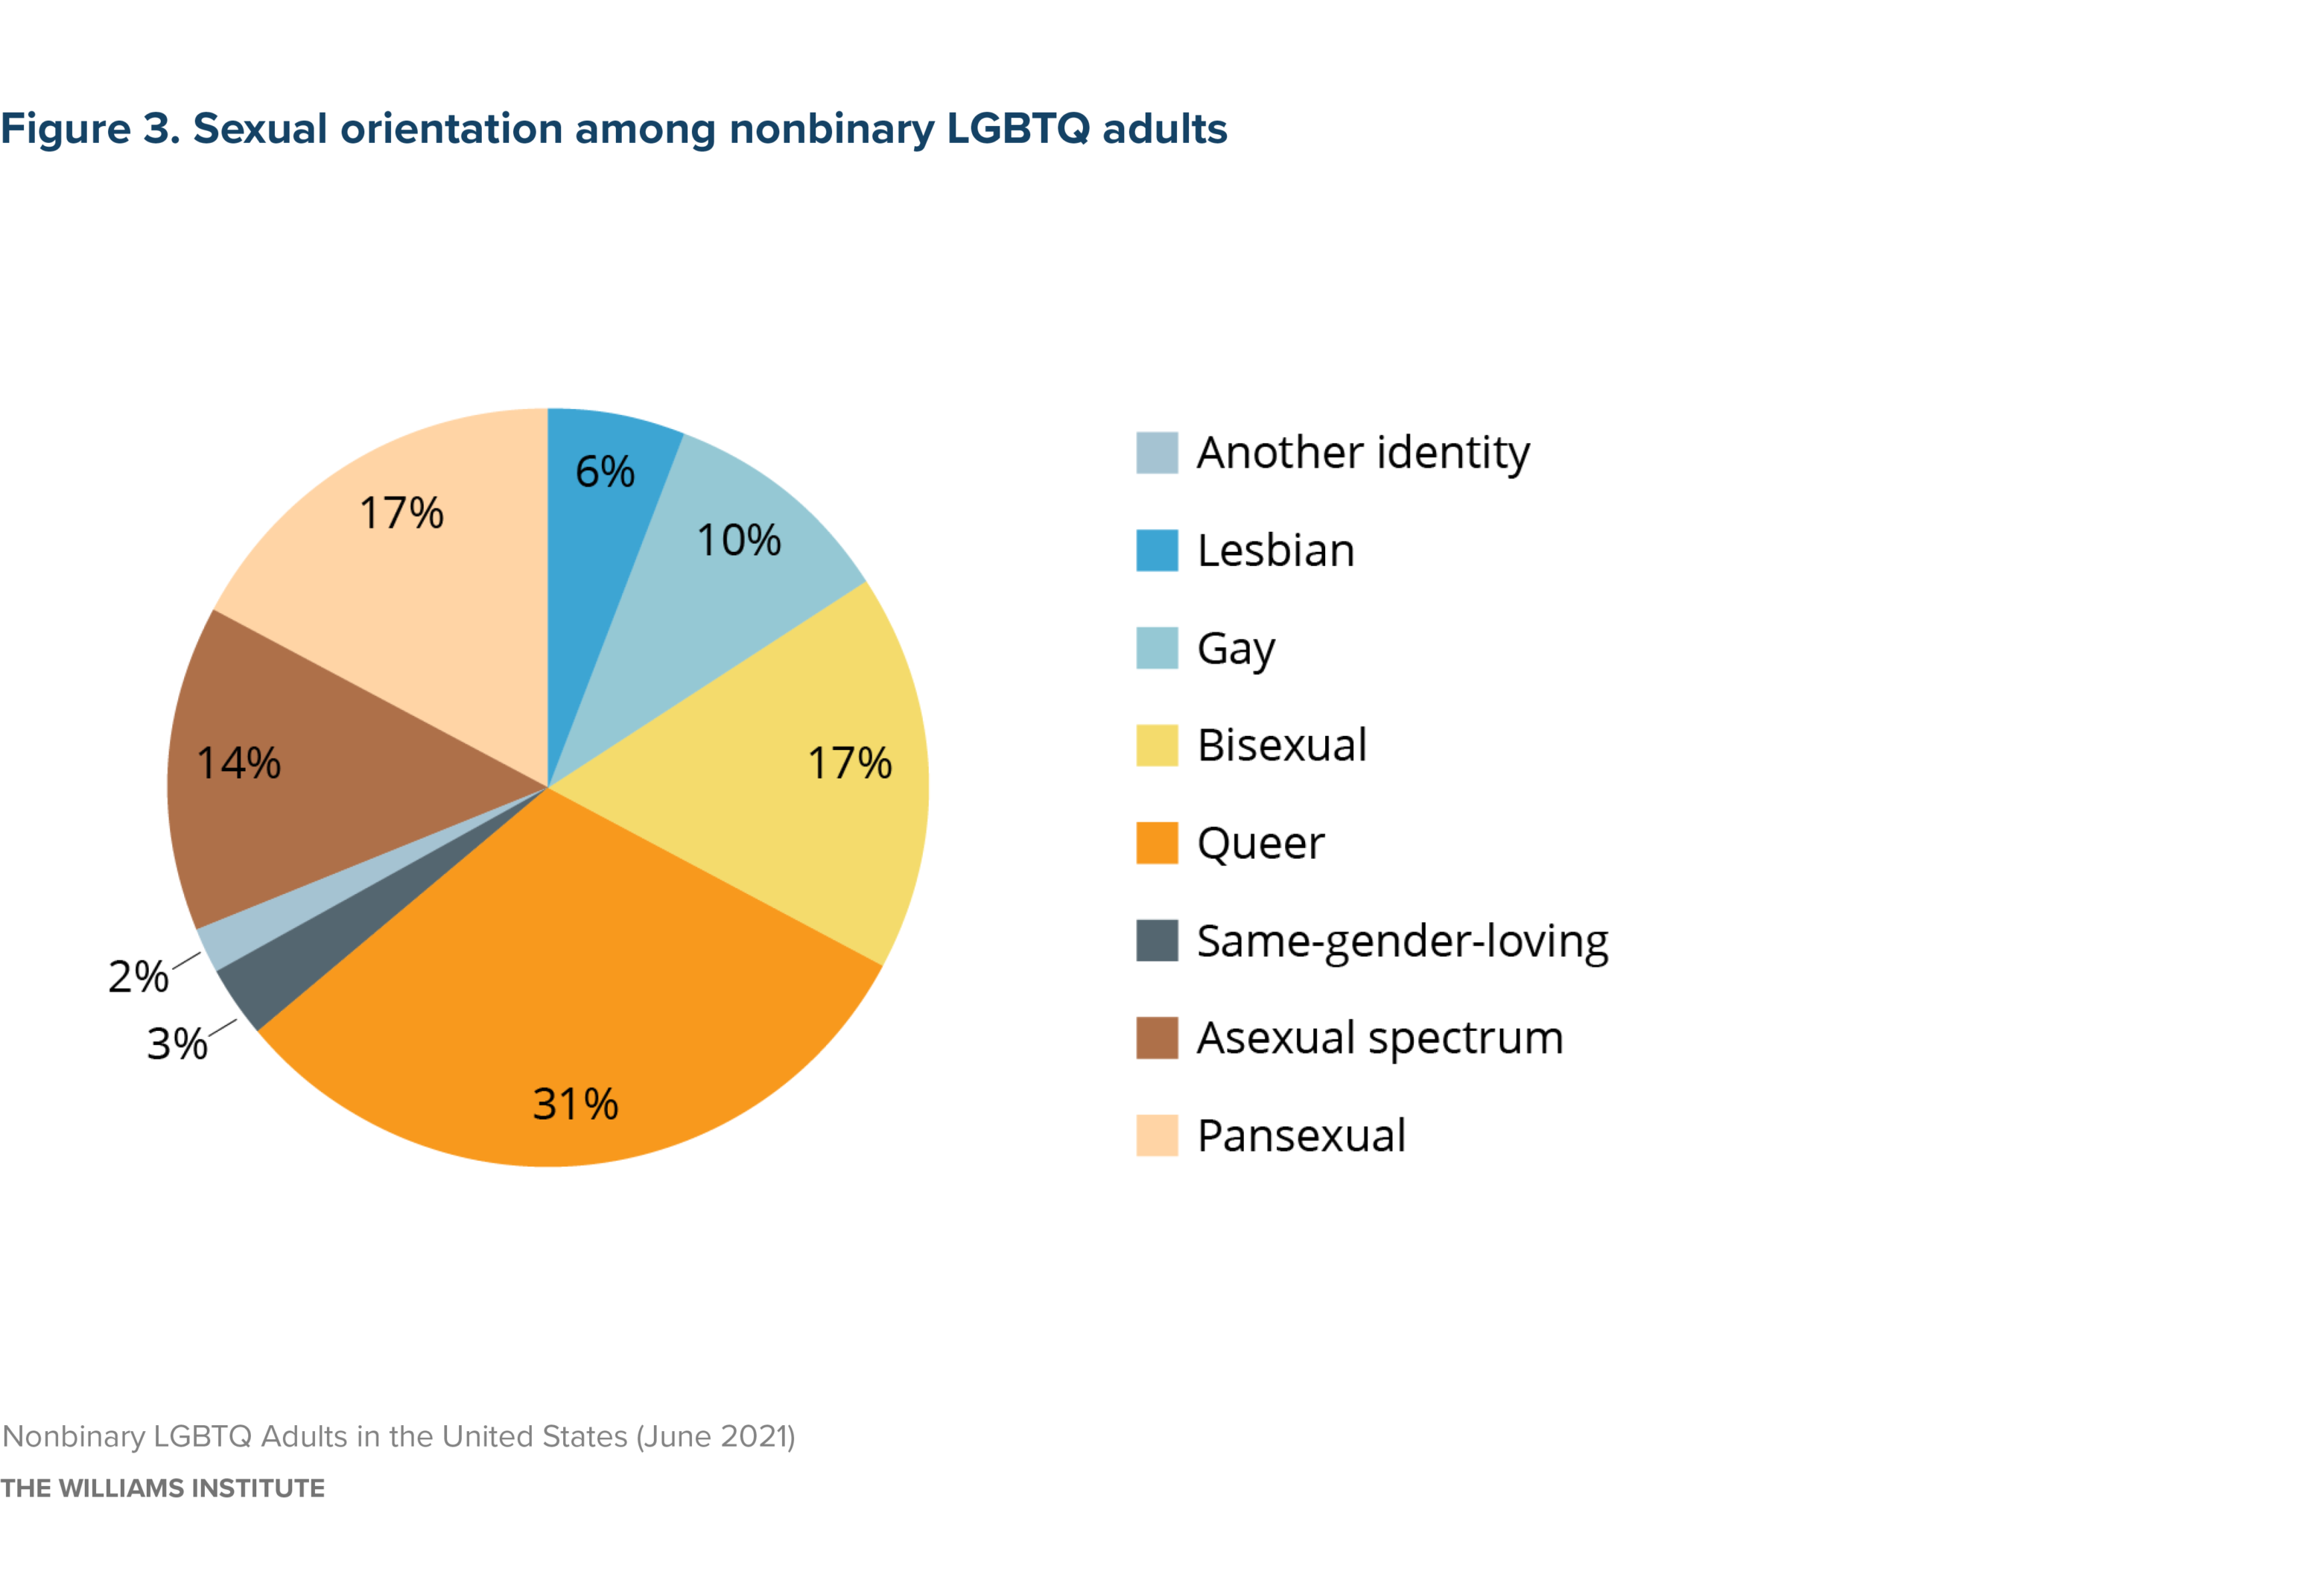
Most nonbinary LGBTQ adults did not identify as transgender (Figure 1). When asked about sexual identities, nonbinary respondents reported that they use a broad range of sexual identity terms—a majority reported queer (31%), bisexual (17%), pansexual (17%), or asexual (14%) identities (Figure 3).
Tables A.1– A.3 provide more information about nonbinary people’s demographic characteristics, socioeconomic status and housing stability, and relationships and parenting. As seen in Figure 4, nonbinary LGBTQ adults report relatively high indicators of economic instability.
Stressful Experiences in Adulthood and Before Age 18
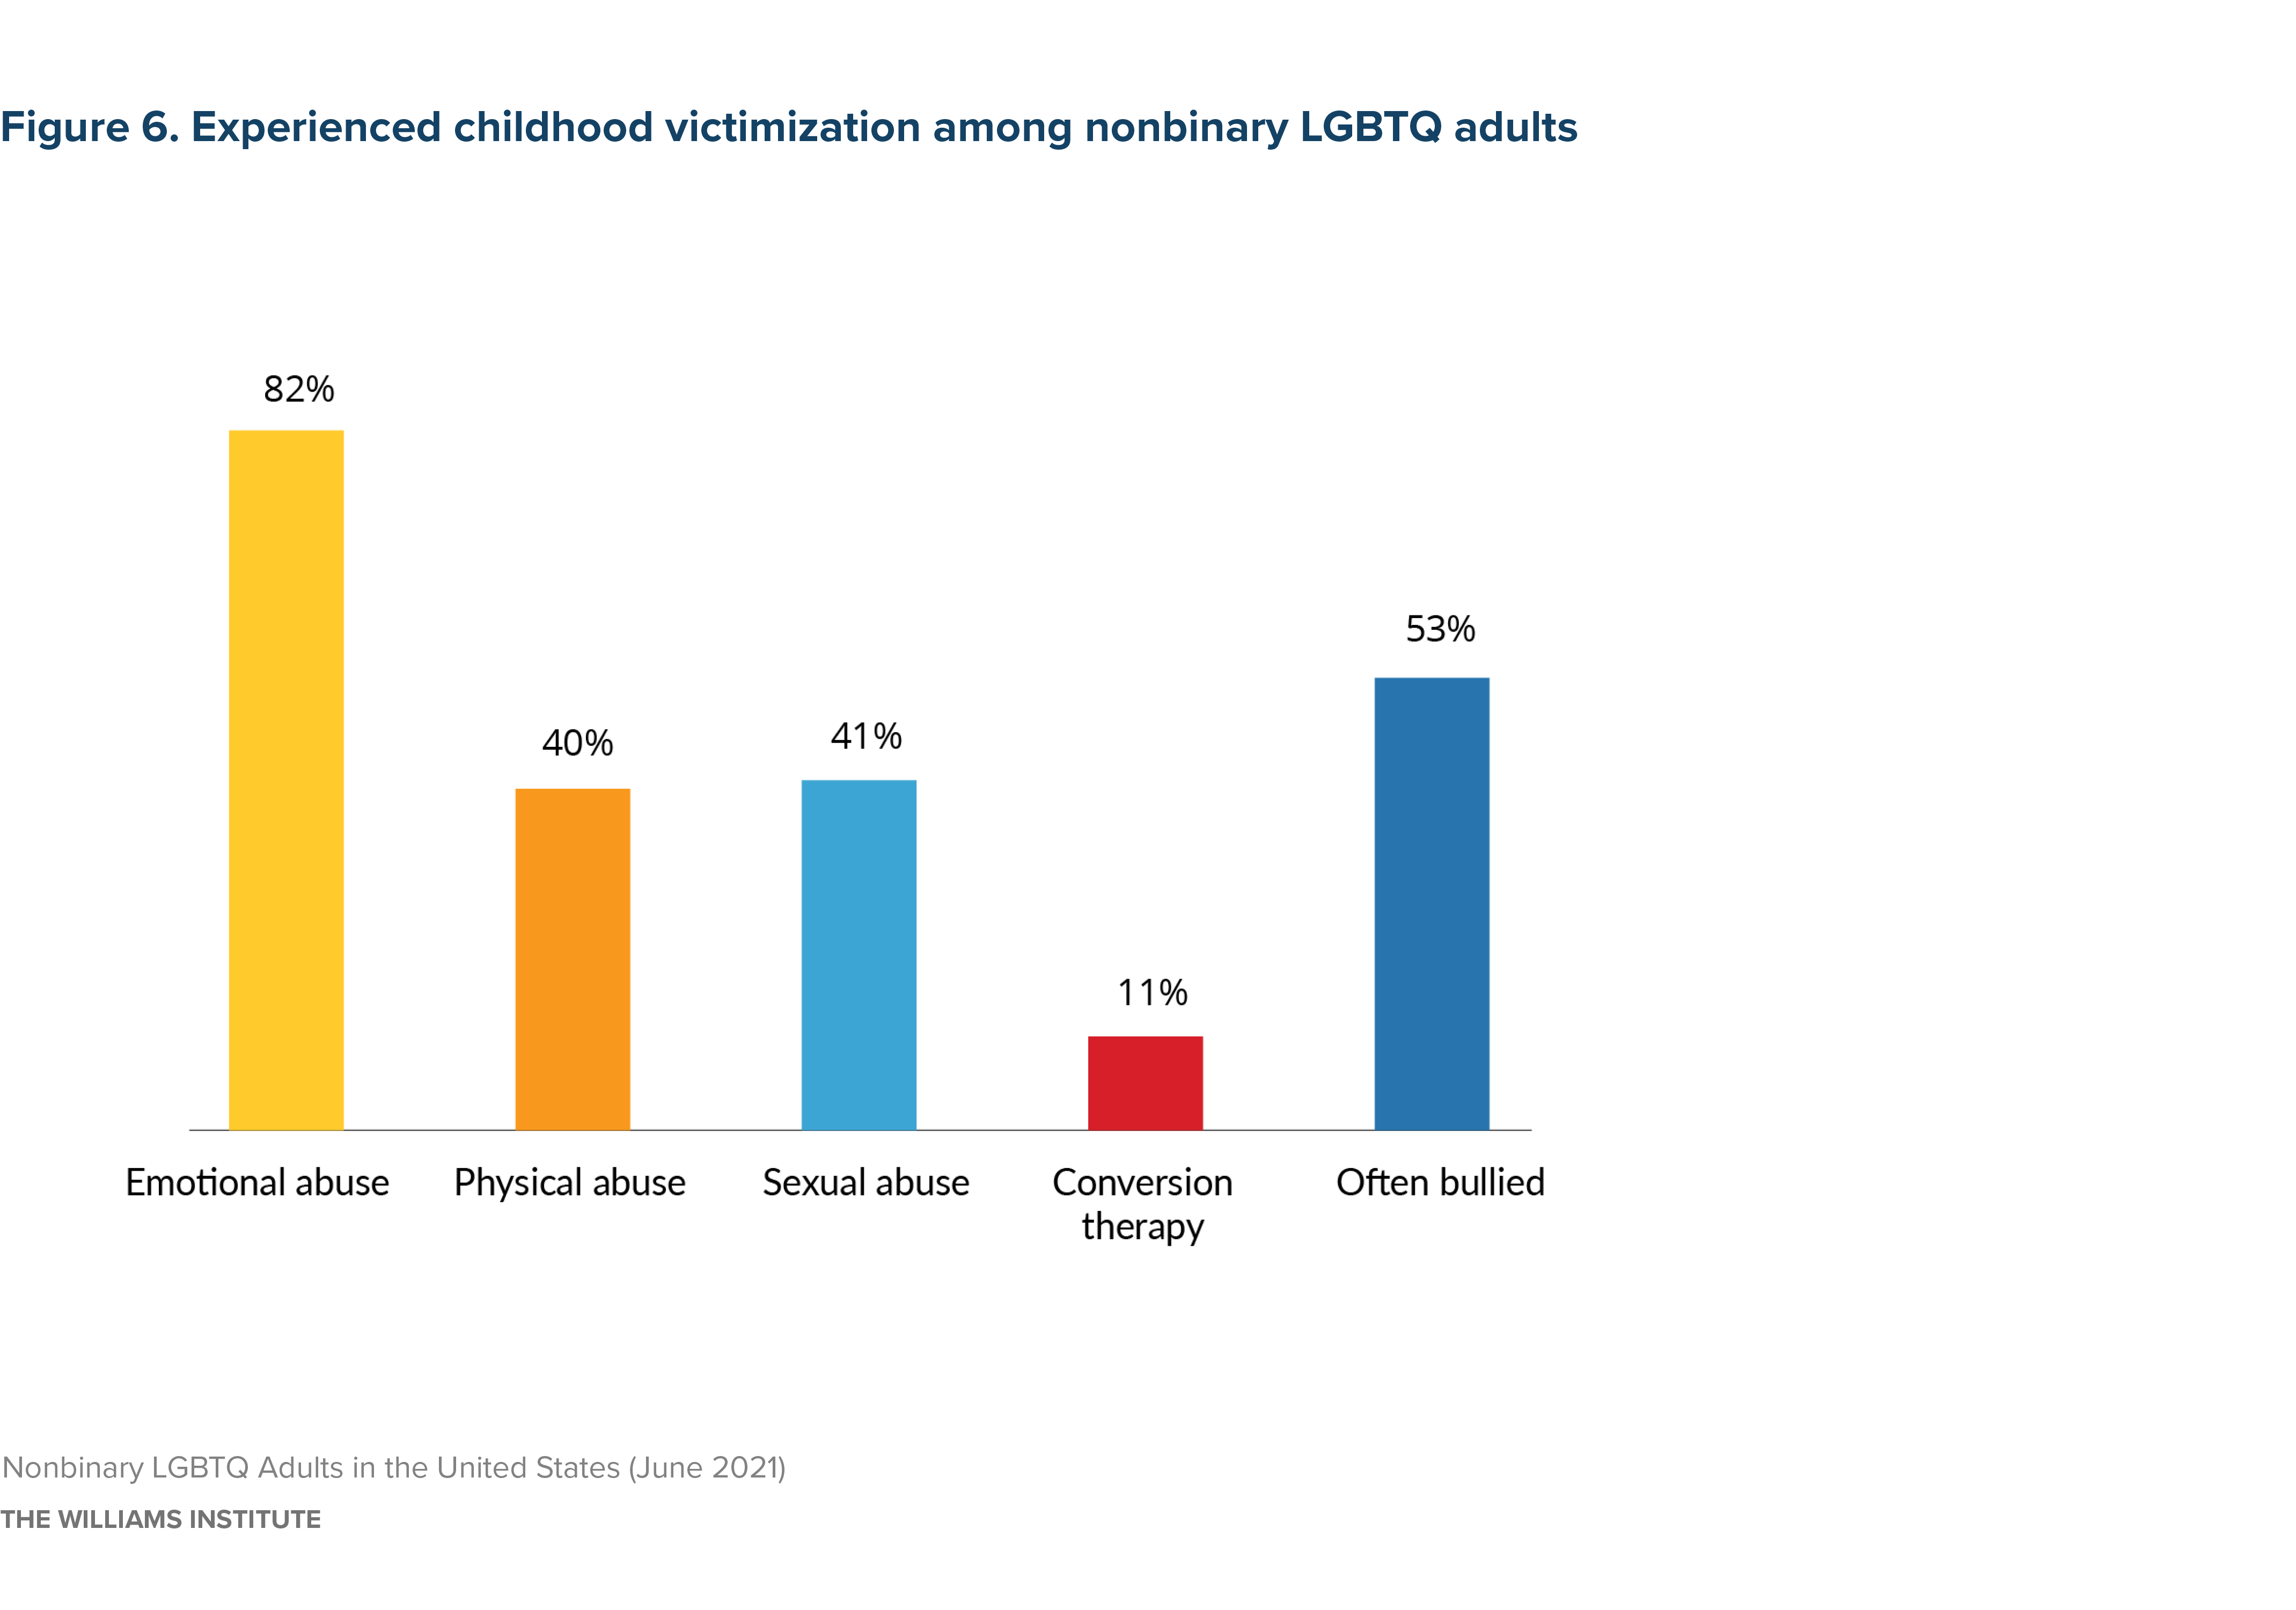
Tables A.4 – A.10 provide information about stress experiences of nonbinary LGBTQ people. These data show that a majority of nonbinary people were hit, beaten, physically attacked, or sexually assaulted (55%) at some points since they were 18 years old (Figure 5). Also, most felt that they were less respected (54%) than other people over the year prior to being interviewed. Many suffered chronic stressors, including not having enough money to make ends meet (68%), feeling mentally and physically tired because of their job (68%), being alone too much (56%), and having strained or conflicted relationships with their parents (60%). Nonbinary LGBTQ adults also experienced stress in childhood (before age 18, Figure 6), including emotional (82%), physical (40%), and sexual (41%) abuse. More than one in ten nonbinary people (11%) had gone through conversion therapy to change their sexual orientation (cis LGBQ respondents) or gender identity (transgender respondents).
Health
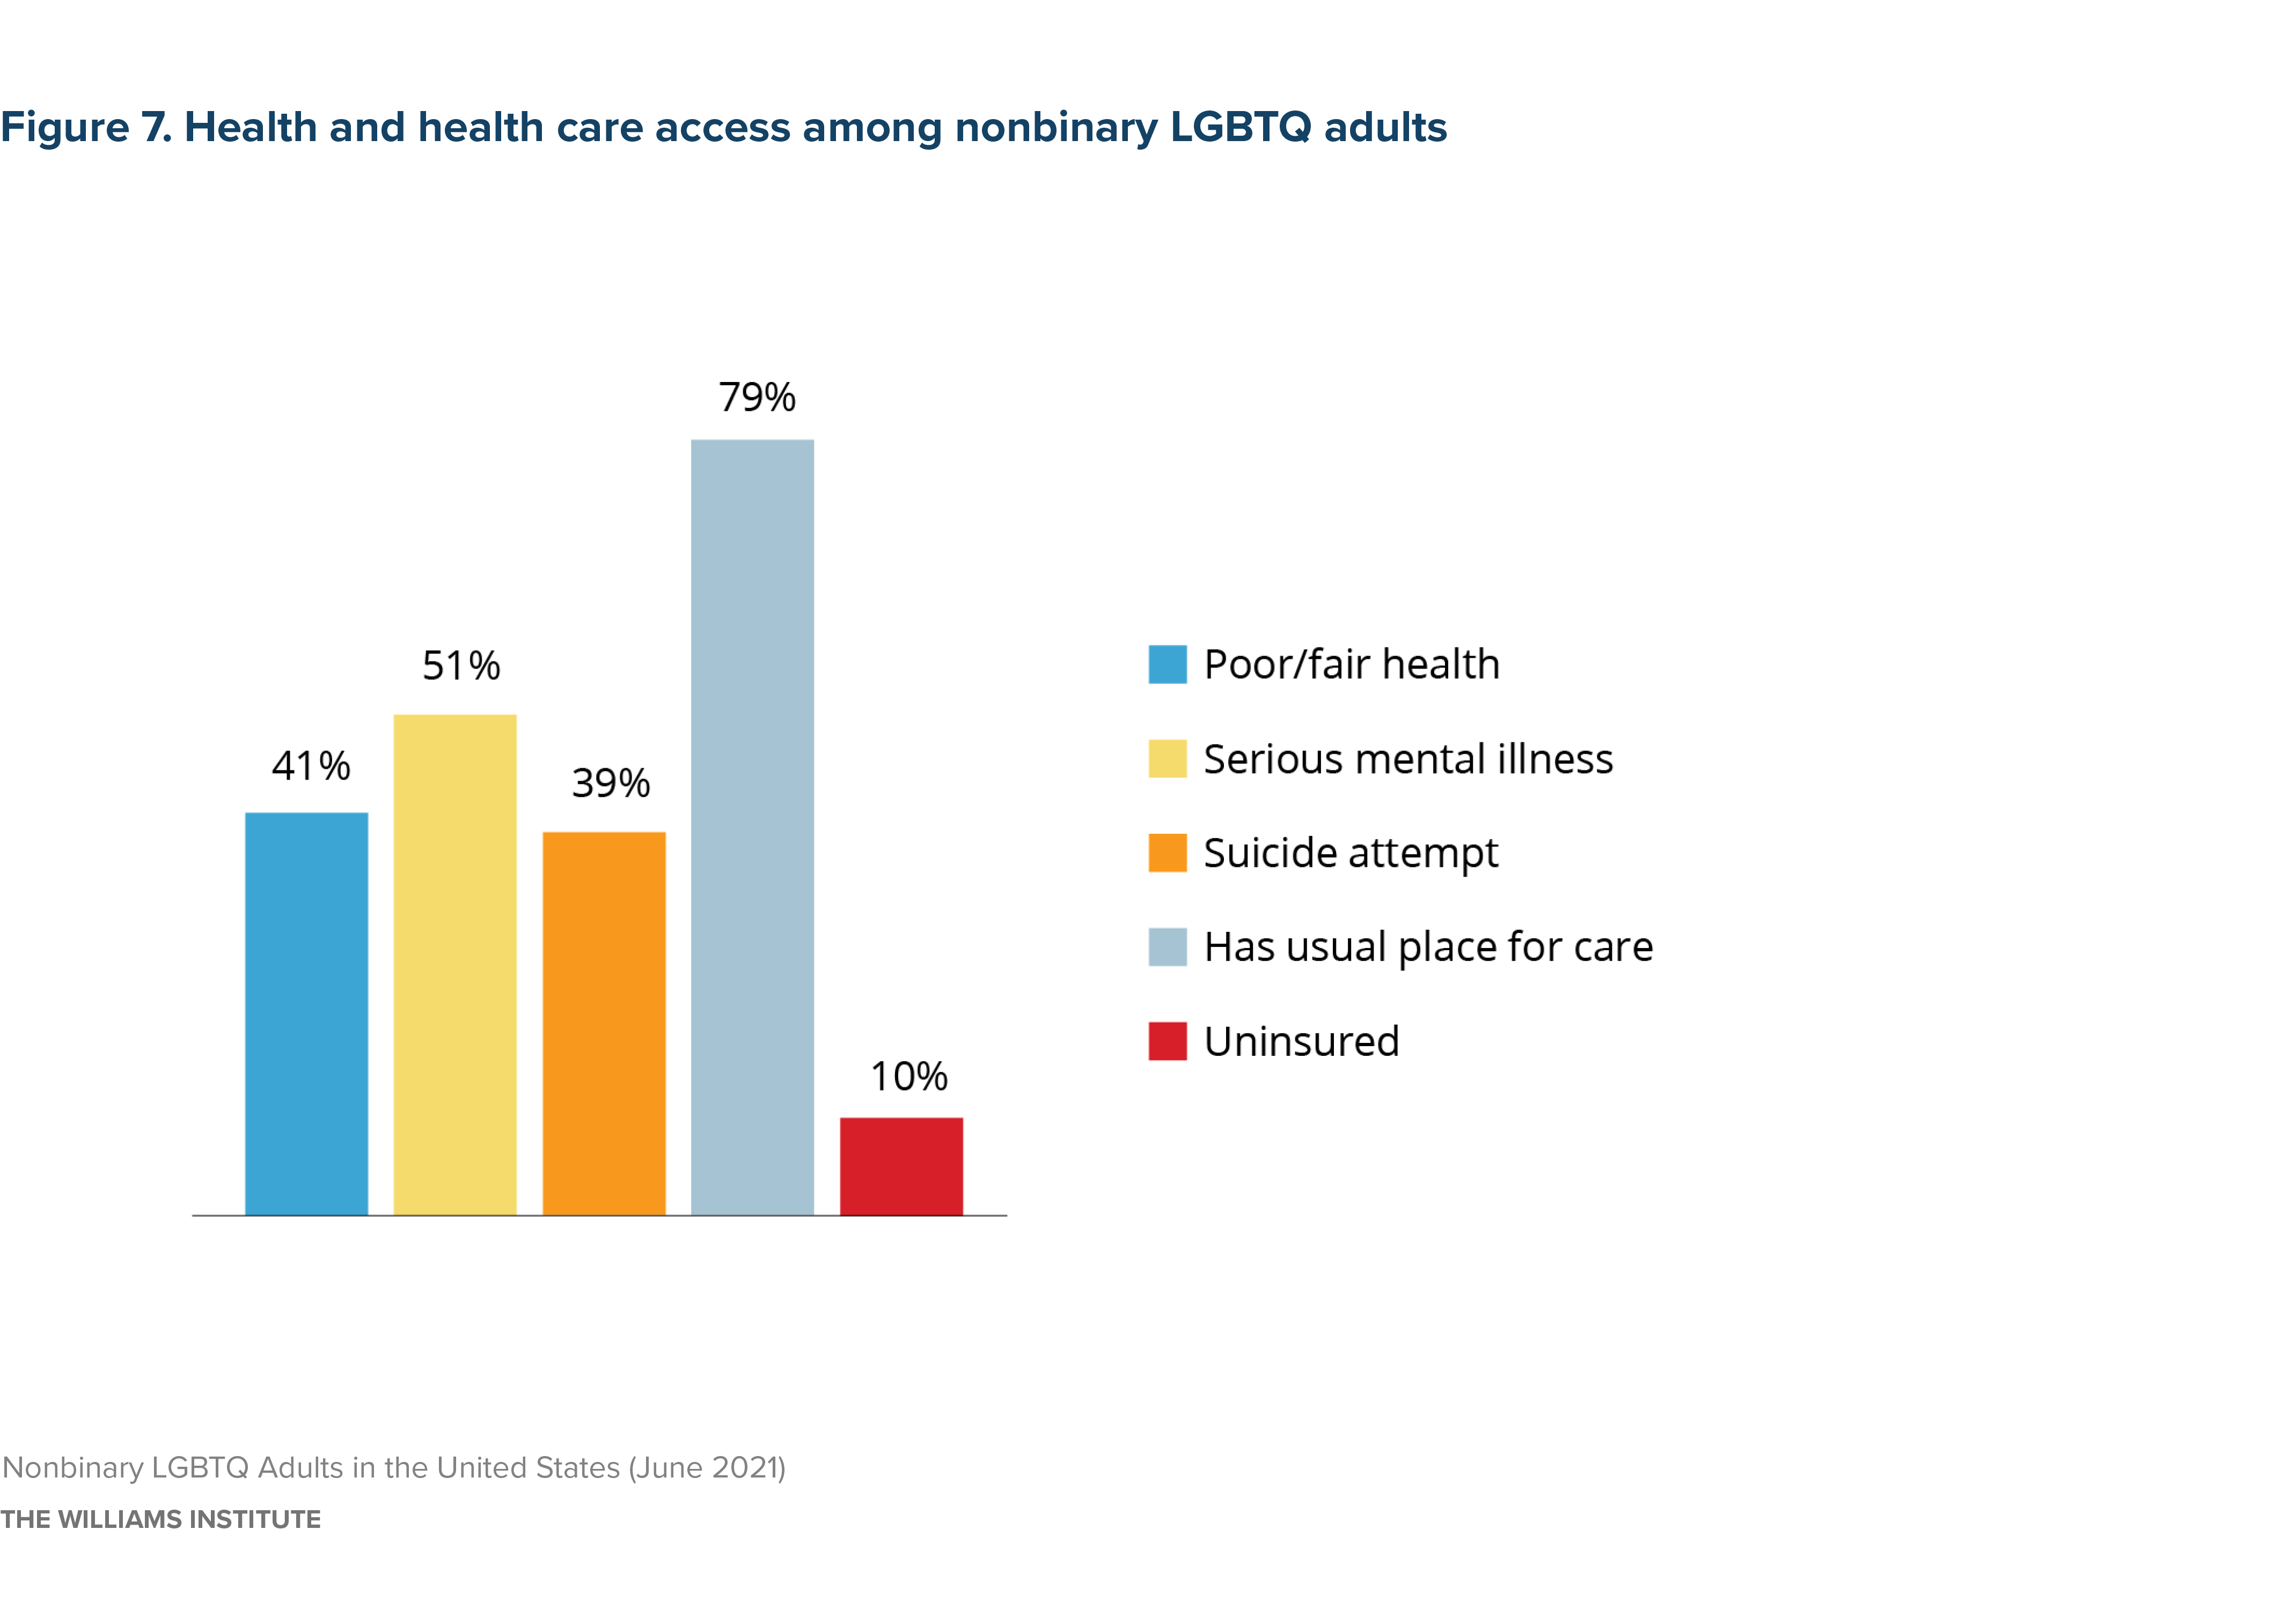
Tables A.11– A.13 provide information about the health and health care of nonbinary LGBTQ people. In terms of physical and mental health (Figure 7), nonbinary LGBTQ adults reported relatively high rates of mental health concerns, including 41% who said their health was poor or fair, 51% who had symptoms consistent with serious mental illness, and 39% who had attempted suicide. The majority (79%) had a usual place where they received health care and had health insurance, but almost 10% lacked health insurance.
Conclusion
Nonbinary people make up approximately 11% of the adult LGBTQ population, approximately 11%. While nonbinary identified adults make up a large share of the transgender population (43%), most nonbinary LGBTQ adults are not transgender. Though this brief is not comparative, the findings show that nonbinary LGBTQ adults have similar vulnerabilities in mental health and income as the general LGBTQ population, especially transgender adults. We recognize that identities and terms related to gender and sexuality shift across time and that our 2016-2018 data reflect a particular historical moment. Given data from large-scale youth surveys illustrating that 2-10% identify with gender minority labels, and many of them identified with gender nonbinary terms, both cisgender and transgender nonbinary subpopulations are likely to be a growing dimension of the LGBTQ population. Future research should continue to identify whether nonbinary LGBTQ adults and youth have significantly different outcomes than do binary (cisgender and transgender) or other transgender-identified LGBTQ adults. This study also highlights a likely gap in research: the demographics and experiences of nonbinary-identified people who do not identify with LGBTQ labels at all.
Download the full brief and tables
