Overview
In the context of the COVID-19 pandemic, inequities in access to food across the United States are especially apparent. Lesbian, gay, bisexual, and transgender (LGBT) people are among the many subgroups of Americans known to experience especially high rates of food insecurity, meaning the experience of not having enough food to eat. Here we report updated figures to our 2016 report on LGBT food insecurity, providing a snapshot of current vulnerabilities at risk of exacerbation during the COVID-19 outbreak.
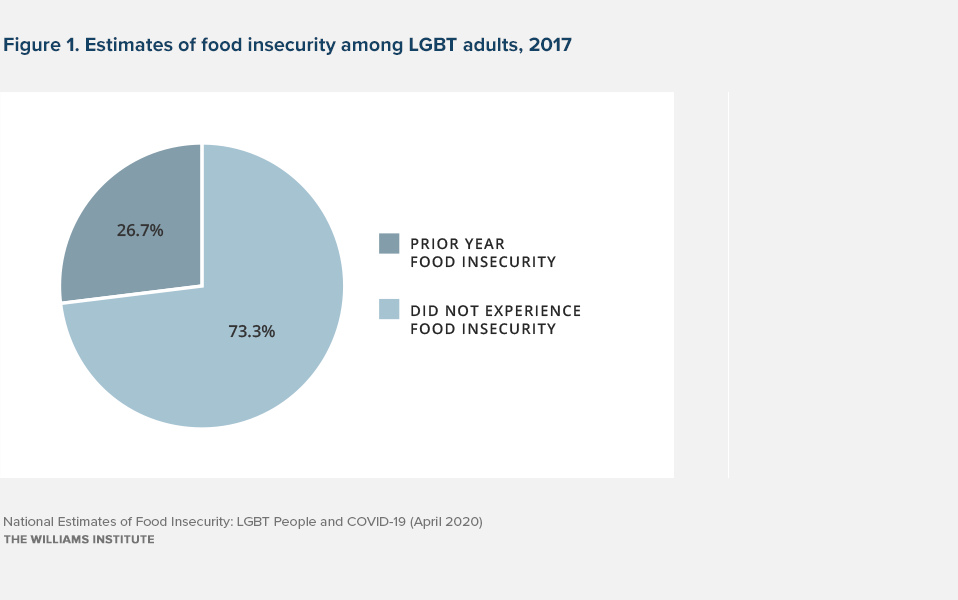
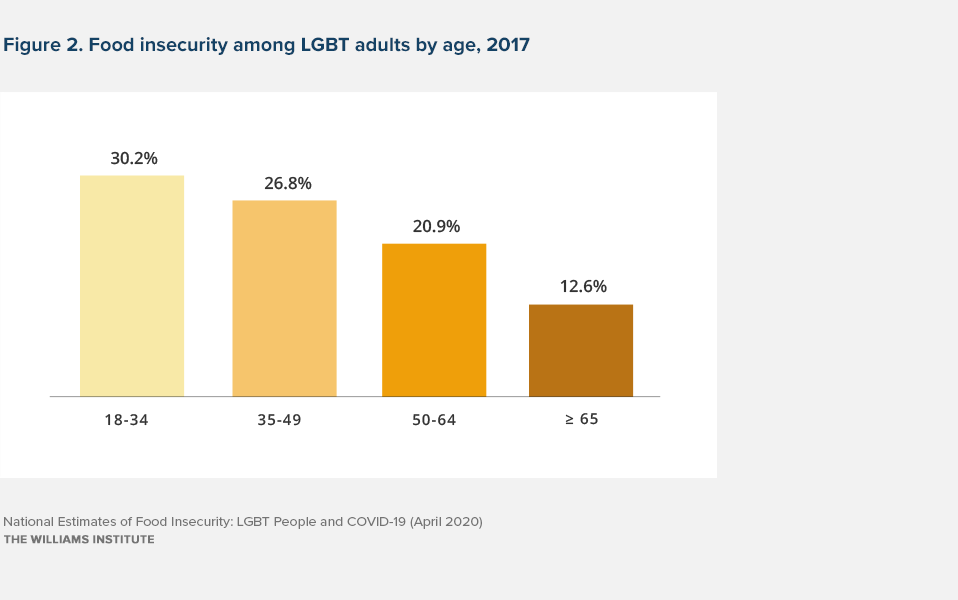
Overall, nearly 27% of LGBT people, an estimated 3,029,000 adults, experienced food insecurity in the past year (see Figure 1). When we look at subgroups of LGBT people, we see that food insecurity is a concern across race and ethnicity, age, and sex, but also that some groups experience food insecurity at especially high levels. With regard to age, young adults have a particularly high rate of food insecurity (see Figure 2).
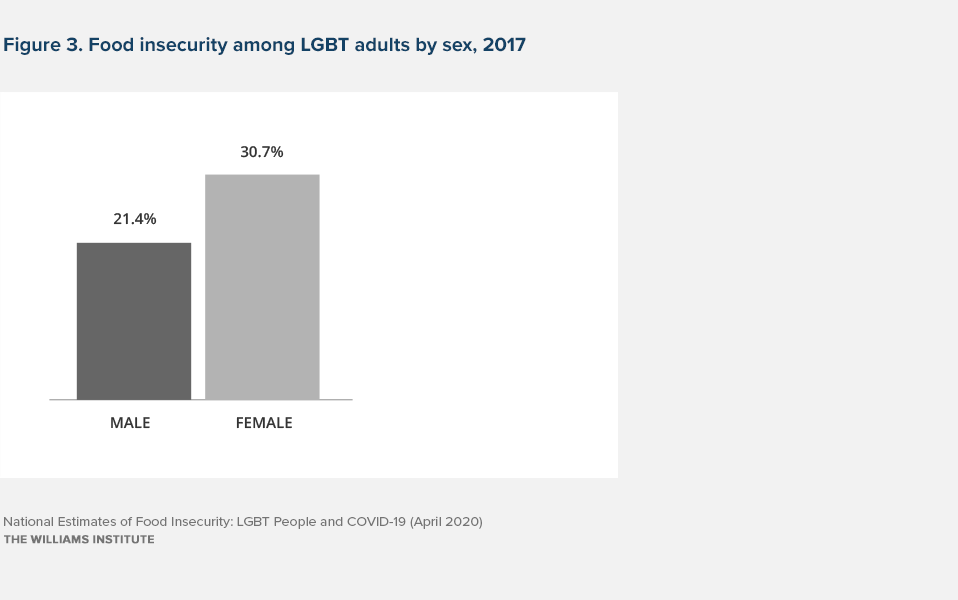
Figure 3 shows that one in three LBT women and one in five GBT men experience food insecurity. Among all food-insecure LGBT adults, the majority (66%) identified themselves as female.
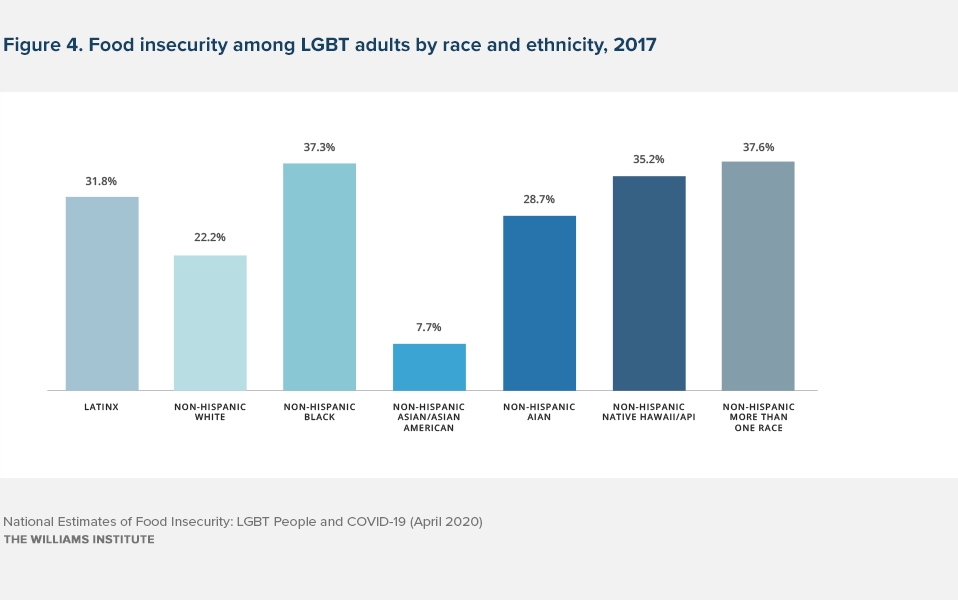
With regard to race and ethnicity, analyses show that all racial and ethnic groups experience some level of food insecurity. However, Black, Latinx, American Indian, and Pacific Islander LGBT people report particularly high rates, and White and Asian/Asian American LGBT people report food insecurity at a lower rate.
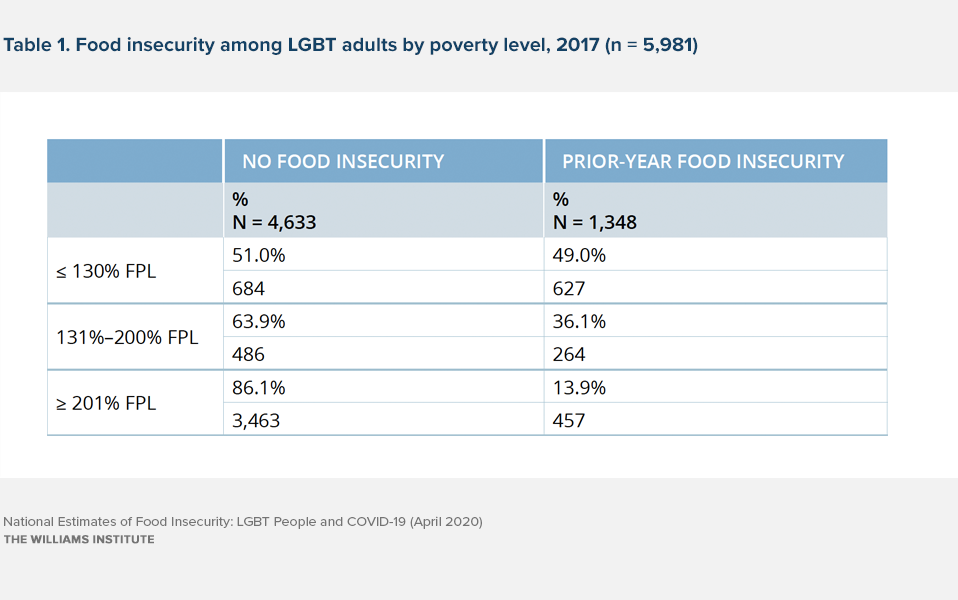
In response to food insecurity, the USDA’s Food and Nutrition Service administers several food and nutrition assistance programs, the largest of which is the Supplemental Nutrition Assistance Program (SNAP). The program provides monthly benefits to purchase food. To be eligible for SNAP benefits, capped at about $350 per month for a household of two in the contiguous United States, households must meet several criteria. One primary criterion is that the household does not exceed a monthly gross income above 130% of the official federal poverty level (FPL) for that household’s size. Our analyses of the 2017 Gallup Poll data show that LGBT people across a range of income levels experience some level of food insecurity. However, it is also clear that people experiencing poverty are at the greatest risk, including those situated slightly above the federal cutoff for SNAP eligibility.
Implications
The high rate of food insecurity among LGBT people has persisted. The overall percentage of LGBT people who report not having enough food to eat is more than twice the proportion found in the general population (11% in 2018, according to the USDA). Although all age, gender, race and ethnicity, and income-level subgroups experienced some food insecurity, levels of food insecurity were highest among adults under 35 years of age, people of color, women, and those with low incomes. Most notably, hunger is a considerable problem among those eligible for food assistance benefits (SNAP) and for about one-third of those living just above the federal poverty level but not currently covered by existing benefits programs. These data provide a national snapshot of a key domain of economic disparities among LGBT people prior to the onset of the COVID-19 pandemic and the resulting job loss, furloughs, and restricted access to foods in stores during 2020. As such, this brief highlights the need for policies and services that connect LGBT people with benefits and services—in particular, those who may have never accessed these services before and now may need help navigating the system. An implication of this work is also the continued need for collecting sexual orientation and gender identity data to track the impact of various efforts to reduce food insecurity.
Methods Note
This fact sheet presents data from the 2017 Gallup Daily Tracking survey from a sample of approximately 160,000 adults aged 18 or older who reside in the 50 U.S. states or the District of Columbia. Respondents were obtained through list-assisted random-digit dialing (70% cell phone, 30% landline) and randomly assigned to the Gallup- Sharecare Well-Being Index survey. This survey was administered by telephone and could be completed in English or Spanish. Respondents were recruited daily for the first half of the year and then weekly starting in July 2017. All percentages are weighted using Gallup poststratification national sampling weights that account for differences in survey sampling fractions, unless otherwise noted, and ensure estimates are representative of the U.S. national population. All reported sample sizes (n’s) are unweighted. All tables and figures with comparisons among the LGBT sample (N = 6,364) represent a significant association between food insecurity and the other variable of interest, tested using the corrected and weighted Pearson chi-square test (Stata svy tab procedure).
LGBT identity is based on responses to the question, “Do you, personally, identify as lesbian, gay, bisexual, or transgender?” Respondents who answered “yes” were classified as LGBT; those answering ”no” were classified as non-LGBT. Respondents were classified as male or female based on their response to the question, “I am required to ask, are you male or female?” Race and ethnicity was defined based on responses to two questions: Hispanic, Latino, or Spanish origin (yes or no) and race (choose all that apply.) Respondents who indicated that they are Hispanic, Latino, or of Spanish origin were classified as Latinx or Hispanic, and all non-Hispanic respondents were classified by race (single race or more than one race). Participant-reported annual household income range and size were used to create an ordinal measure of percentage of poverty. Annual household income was recoded to the midpoint for each income range or to the lower limit of the top 5% of household incomes, as measured by the U.S. census, for those who selected the highest income category ($120,000 or more). Recoded income was divided by size-specific poverty thresholds[footnote id=’6′] to obtain percentage poverty (i.e., the ‘‘income-to-needs ratio’’ according to U.S. census criteria).[footnote id=’7′] Respondents were then placed into one of three economic status groups: < 130% (SNAP eligible[footnote id=’8′] ), 131%–200%, and > 201%of the federal poverty level. Food insecurity was defined as ever “not having enough money to buy food that you or your family needed” in the past 12 months.
Download the brief