Executive Summary
More than 11.3 million LGBT adults live in the U.S. They are a part of every community throughout the country, and they are diverse in terms of personal characteristics, socioeconomic outcomes, health status, and lived experiences. While LGBT people are similar to their non-LGBT counterparts in many ways, they also show differences that illuminate their unique needs and experiences related to sexual orientation and gender identity.
About 40% of LGBT adults are people of color, including 1% who identify as American Indian and Alaska Native (AIAN) only, and 1% who identify as AIAN in combination with at least one other race or ethnicity. In this report, we analyze data from several sources to provide information about adults who self-identify as AIAN and LGBT. We present an overview of their demographic characteristics and focus on several key domains of well-being, including mental health, physical health, economic health, and social and cultural experiences. In addition, we compare AIAN LGBT and non-LGBT adults across these indicators in order to explore differences related to sexual orientation and gender identity among AIAN Americans. For several key indicators, we also compare AIAN LGBT and non-LGBT women with AIAN LGBT and non-LGBT men in order to explore differences related to gender. Where possible, we distinguish between those who identify only as AIAN (AIAN-only) and those who identify as AIAN in combination with at least one other race or ethnicity (AIAN-multiracial). This research suggests that the reason for those differences are related to the degree of support and vulnerability to oppression connected to living on or near American Indian land.
This report is part of a larger series, LGBT Well-Being at the Intersection of Race, which provides the same information for each racial/ethnic minority group in the United States. A final comparative report examines differences across racial groups among LGBT people.
Overall, we found that AIAN LGBT people report high levels of discrimination and violence, and yet many report strong social support and connection to LGBT and AIAN communities. Fewer AIAN-only adults, regardless of LGBT status, were under 25 years of age and living in urban areas compared to AIAN multiracial adults. AIAN-only LGBT adults typically reported similar outcomes to their non- LGBT counterparts, whereas AIAN-multiracial LGBT adults tend to fare worse than their non-LGBT counterparts. This could be in part explained by the age and race differences between the AIAN-only and AIAN-multiracial groups.
Key Findings
Demographic Characteristics
- An estimated 285,000 American Indian and Alaska Native (AIAN) LGBT adults live in the U.S., including those who only identify as AIAN (161,000) and those who identify as AIAN and an additional racial group(s), i.e., multiracial (124,000). Approximately 6% of all AIAN-only adults identify as LGBT.
- AIAN-multiracial adults identified with a range of other ethnicities, most commonly White, Black, and Latinx. However, fewer AIAN-multiracial LGBT people identified as White than non- LGBT people.
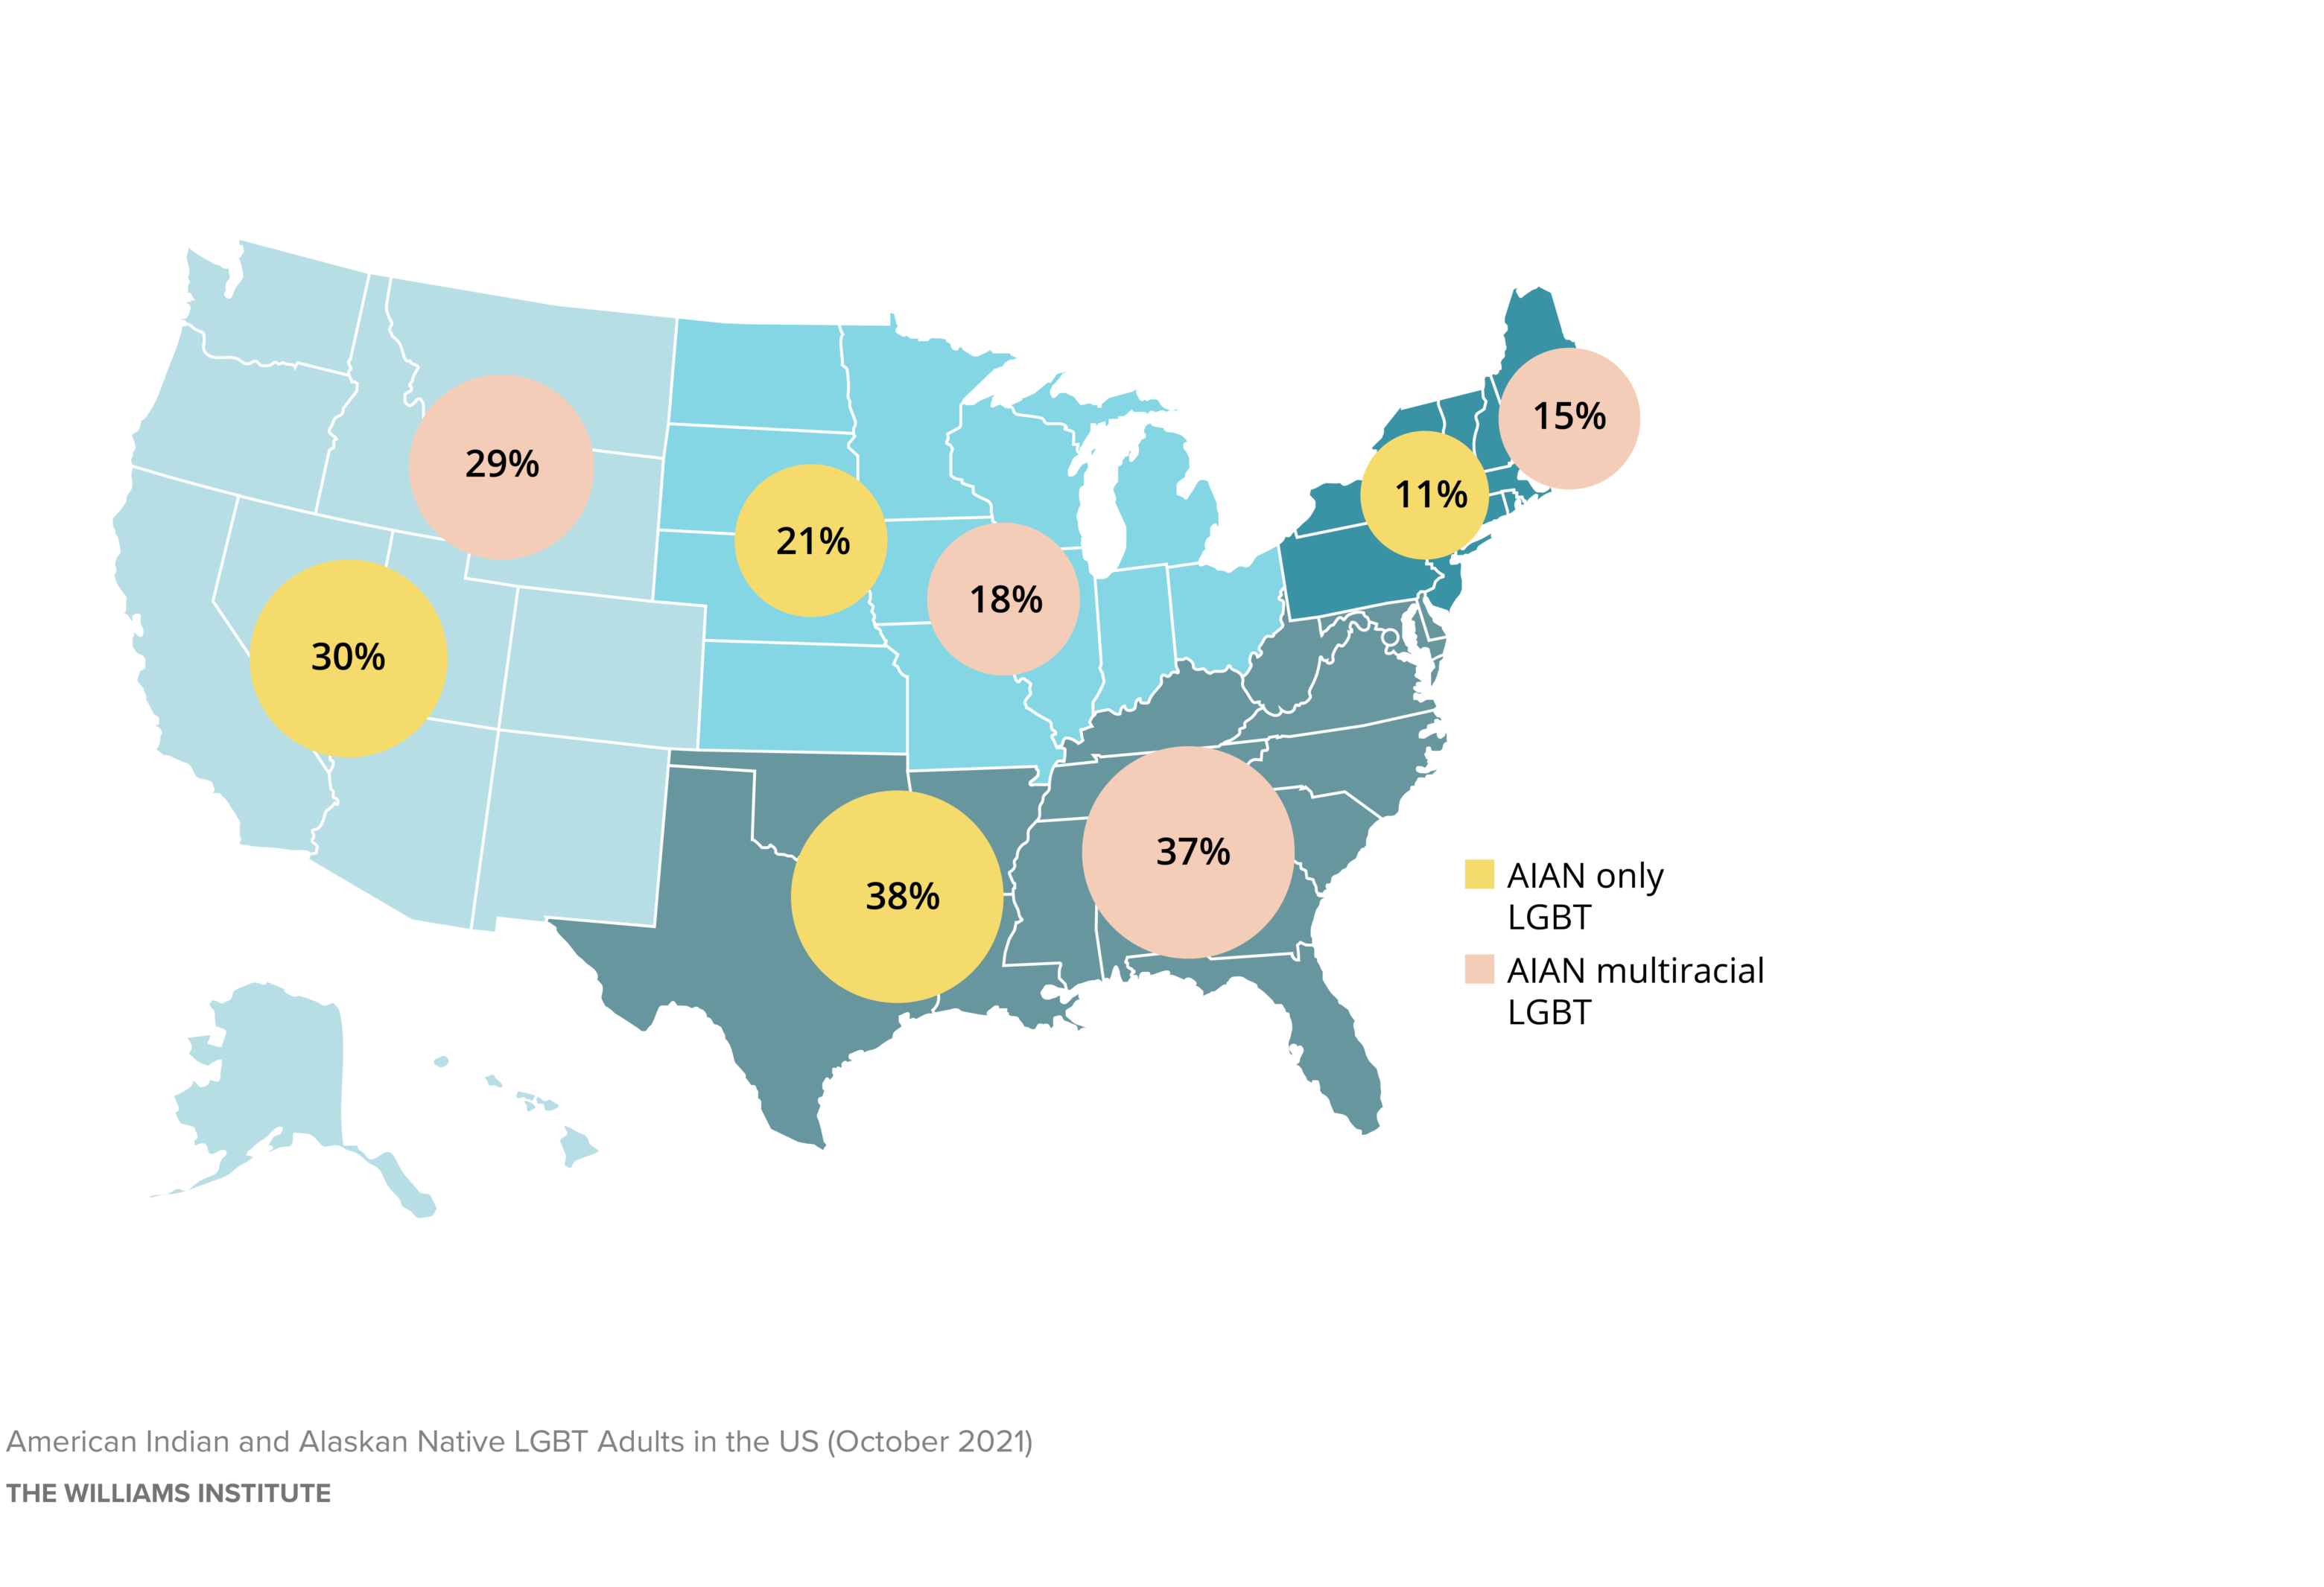
- More than 60% of AIAN LGBT adults in the U.S. live in the West and South.
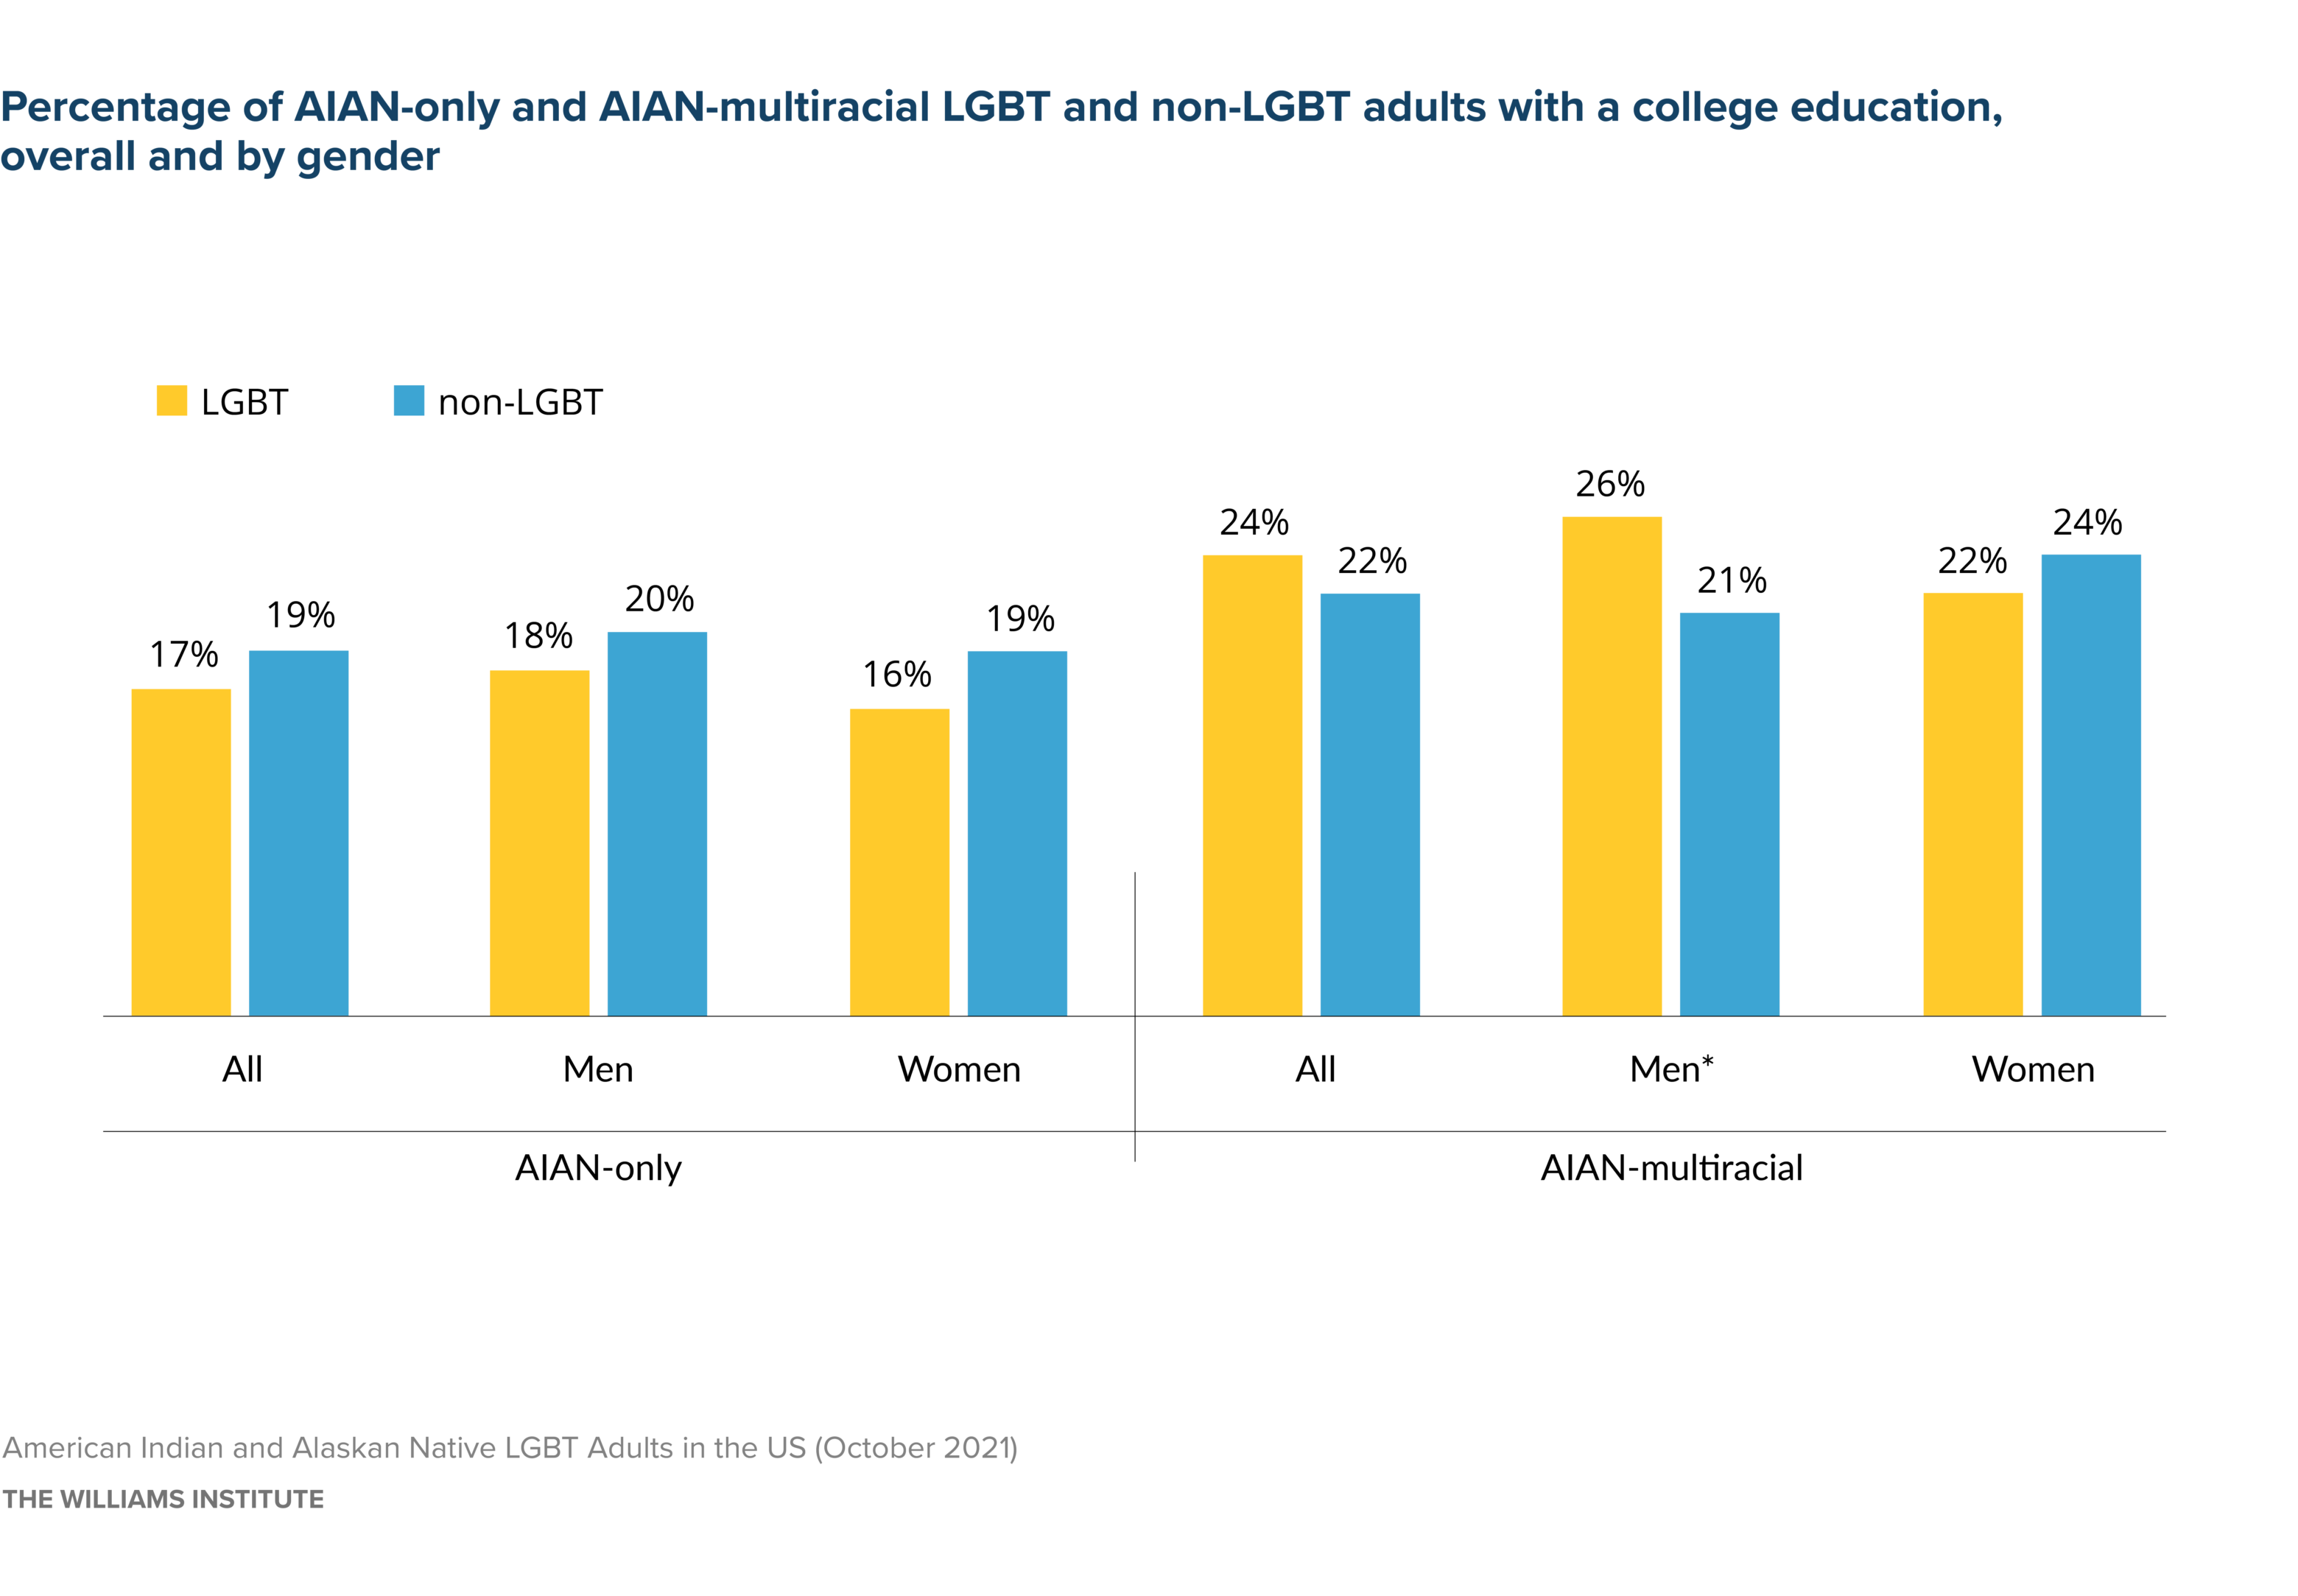
Source: Gallup 2012–2017 data
Note: * indicates that estimates between LGBT and non-LGBT adults are statistically different.
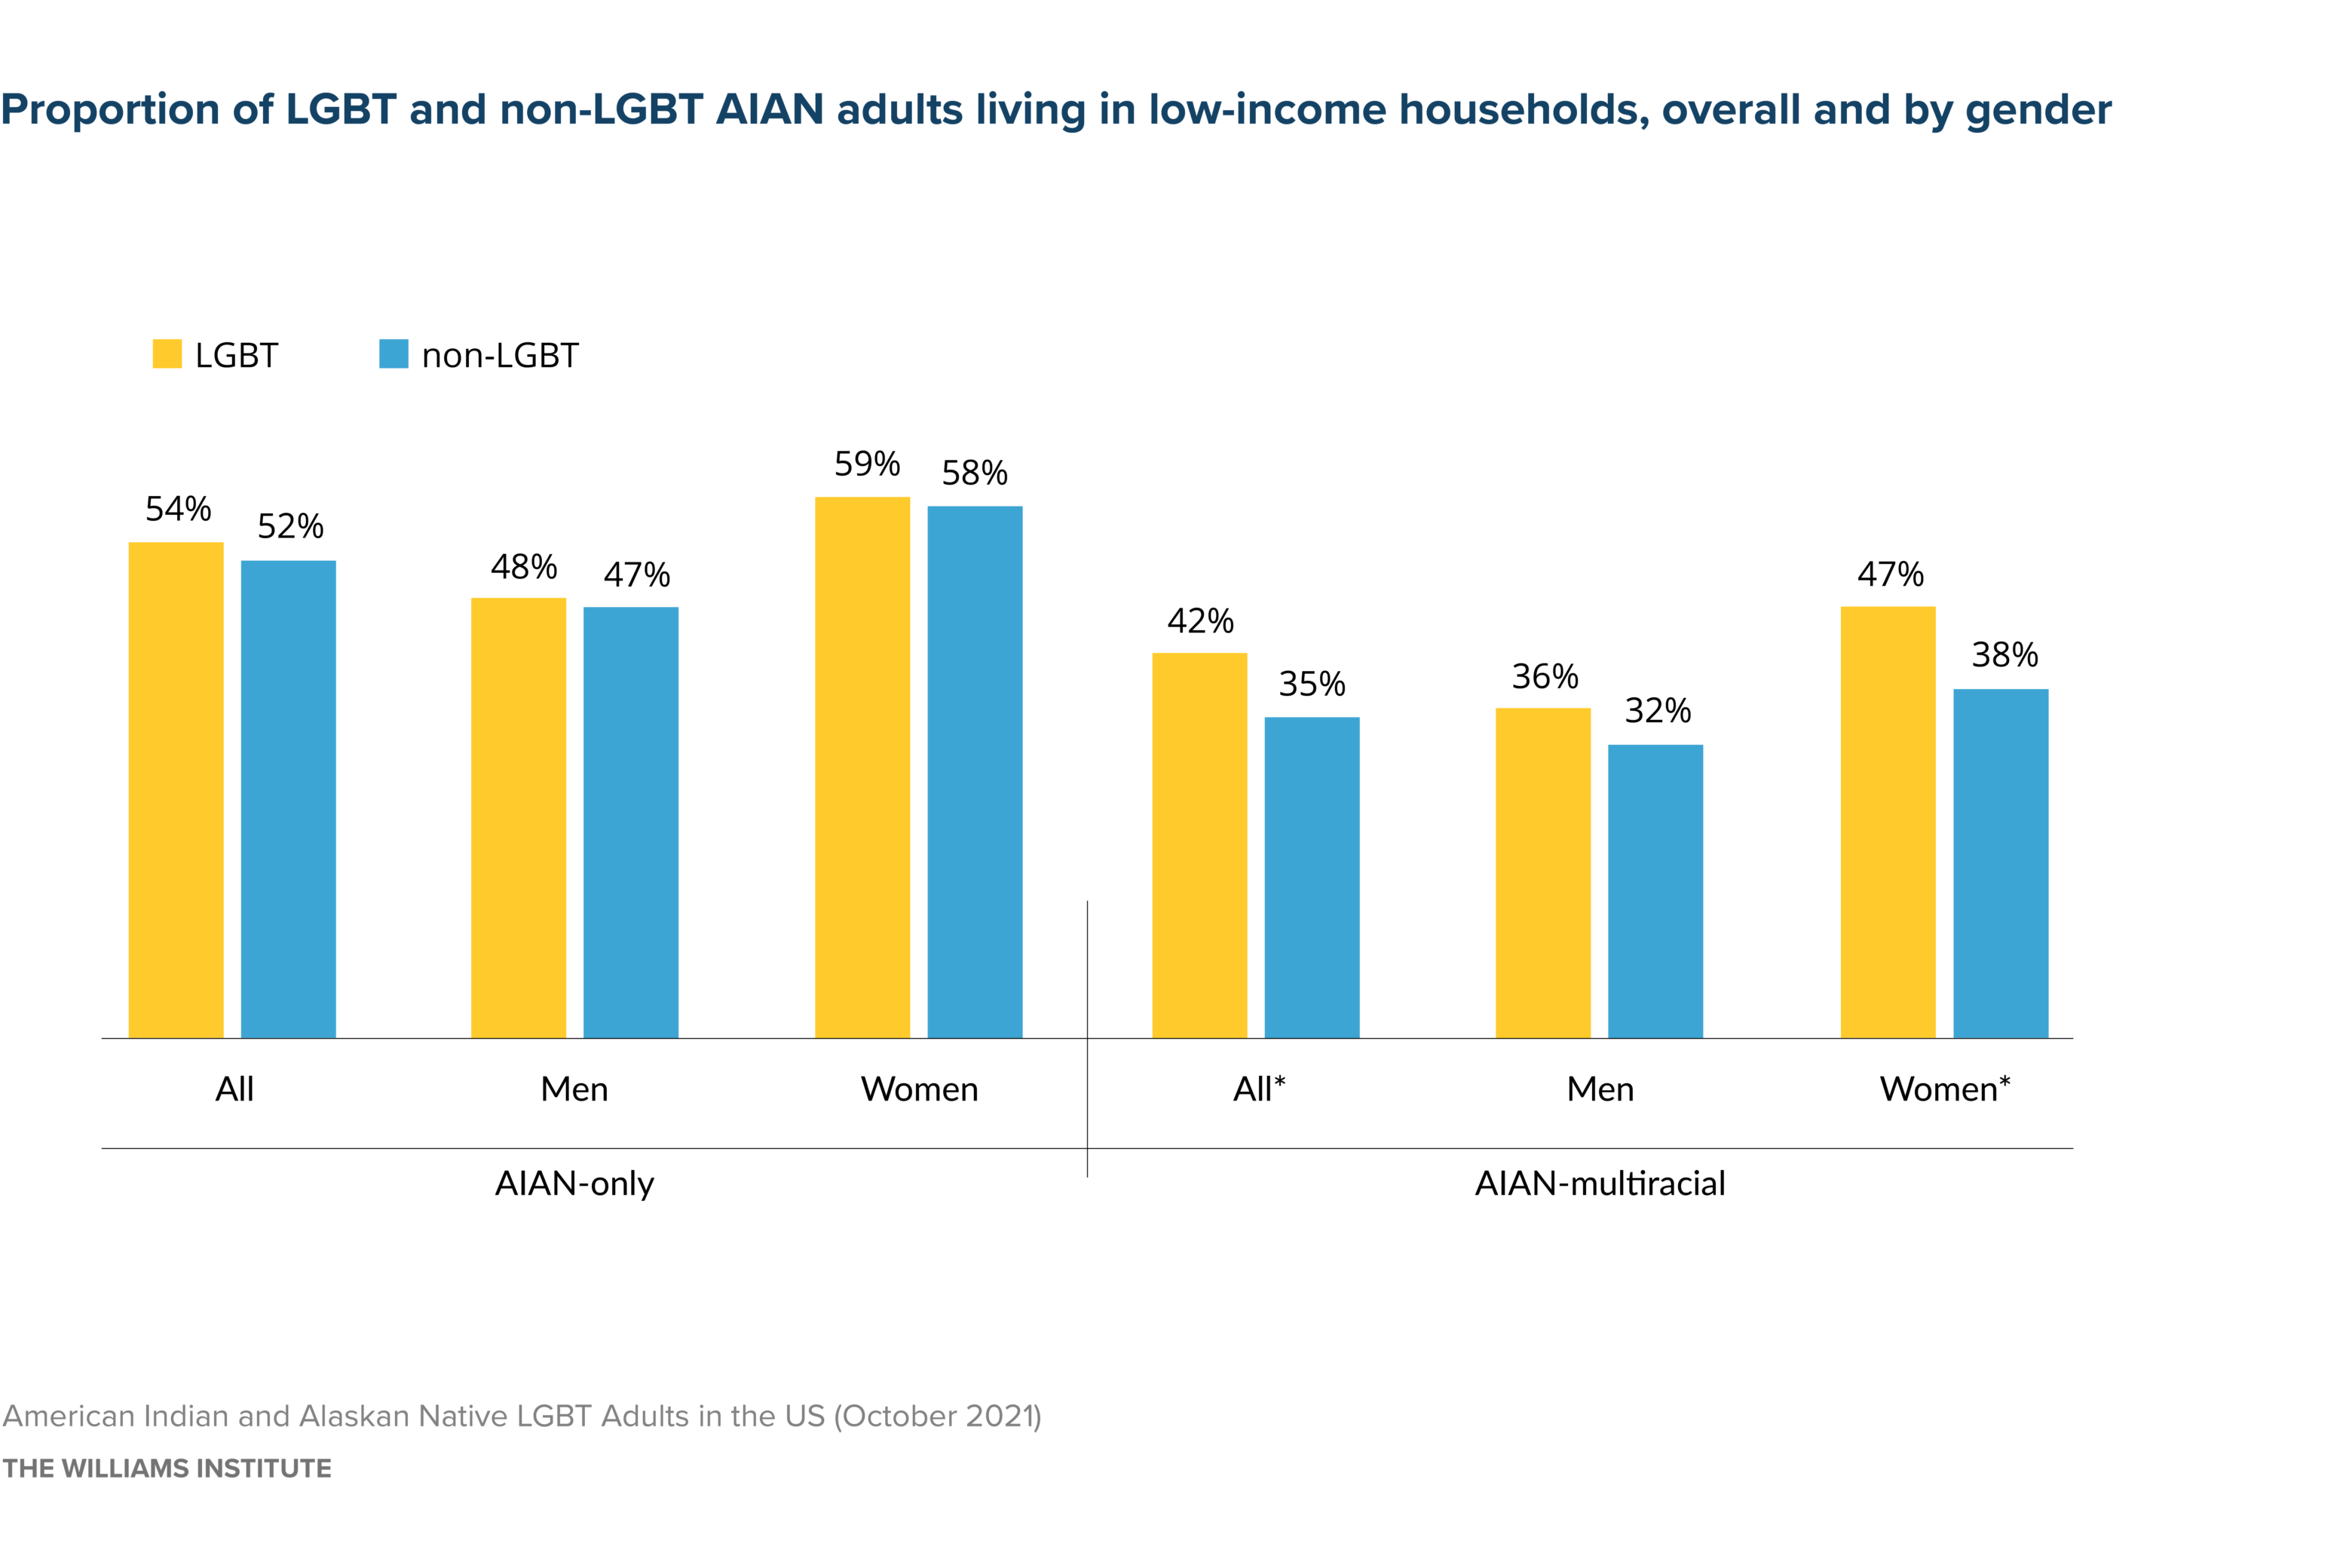
Source: Gallup 2012–2017 data
Note: * indicates that estimates between LGBT and non-LGBT adults are statistically different.
Mental and Physical Health
- More AIAN-only LGBT men (23%) and AIAN-multiracial LGBT women (34%) reported fair or poor health compared to their non-LGBT counterparts (18% and 28%, respectively).
- Among all AIAN adults, more LGBT than non-LGBT people have been diagnosed with depression, with the largest difference in rates among AIAN-multiracial adults (43% among LGBT vs. 25% among non-LGBT).
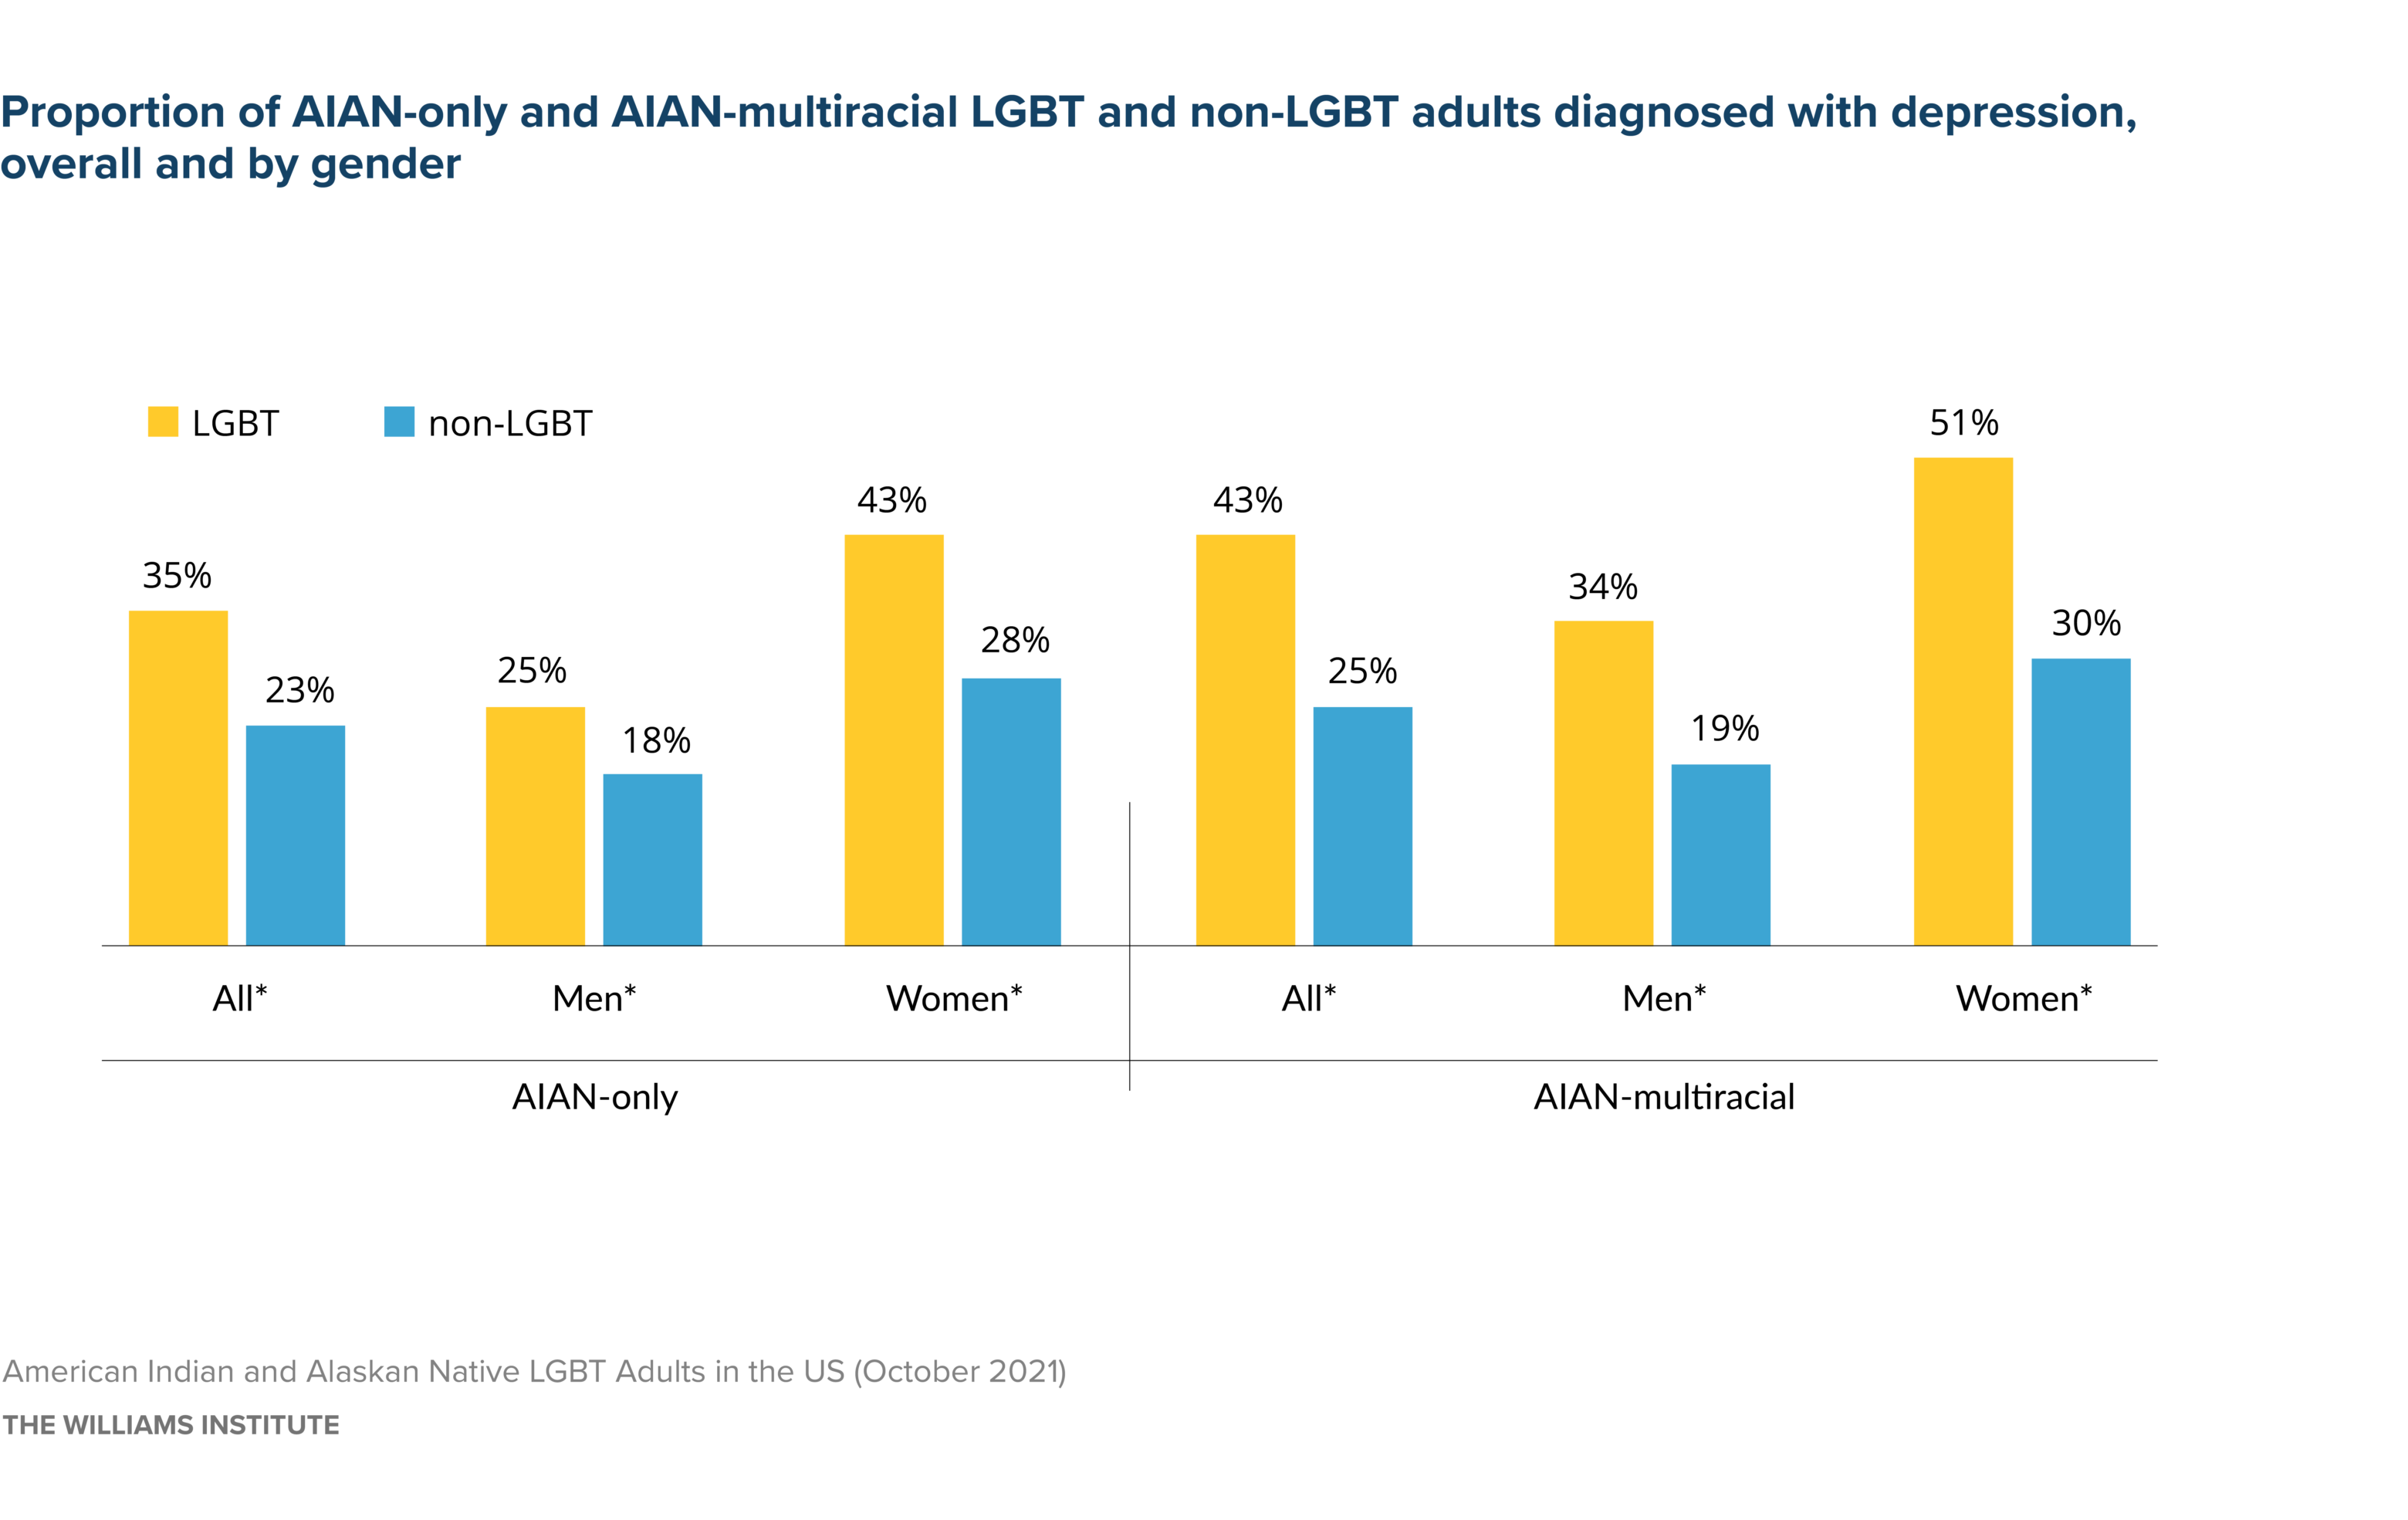
Source: Gallup 2012–2017 data
Note: * indicates that estimates between LGBT and non-LGBT adults are statistically different.
- AIAN LGBT adults, particularly women, are more likely to engage in high-risk health behaviors than AIAN non-LGBT adults. For example, among AIAN LGBT women, 16% of AIAN-only and 8% of AIAN-multiracial women reported heavy drinking, compared to approximately 3% of all AIAN non-LGBT adults.
- Compared to non-LGBT adults, AIAN-multiracial adults have a higher prevalence of several serious health conditions, including asthma, diabetes, heart attack, cancer, high blood pressure, and high cholesterol. Among AIAN-only adults, LGBT adults have a higher prevalence of asthma (19% vs. 16%) and heart attacks (8% vs. 5%) compared to non-LGBT adults. The higher prevalence of heart attacks among AIAN-only LGBT adults appears to be driven by the high rate among women.
Access to Health Care
- AIAN LGBT adults are more likely to lack health insurance than non-LGBT adults: 25% of AIAN LGBT adults are uninsured, compared to about 20% of non-LGBT adults.
- Similar proportions of AIAN-only LGBT and non-LGBT adults are receiving Medicaid. However, a higher proportion of AIAN-multiracial LGBT adults than non-LGBT adults receive Medicaid.
- Additionally, AIAN LGBT women are more likely to receive Medicaid (approximately 20%) than AIAN LGBT men (approximately 10%).
- AIAN women with children are more likely to receive Medicaid than women without children and men with or without children. The rate of Medicaid enrollment for LGBT women with children is particularly high (approximately 30%).
- Overall, fewer AIAN-only (64%) and AIAN-multiracial (68%) LGBT adults than non-LGBT adults (71% and 74%, respectively) reported having a personal doctor.
Discrimination and Stressful Events
- More AIAN LGBT adults reported feeling unsafe compared to their non-LGBT counterparts. Approximately 20% of AIAN LGBT adults said that they disagreed with the statement “You always feel safe and secure,” compared to 14% of AIAN non-LGBT adults.
- Many AIAN LGBT adults reported experiences of discrimination and victimization. For example, 81% of AIAN LGBT adults reported having experienced everyday forms of discrimination in the prior year (such as being treated with less courtesy than other people), 57% reported experiencing physical or sexual assault at some point as an adult, and 81% reported experiencing verbal assault or abuse at some point as an adult.
- Many AIAN LGBT adults experience financial and job-related stress. For example, 75% reported not having had enough money to make ends meet in the prior year, 19% reported that they were fired or laid off in the prior year, and 49% reported experiencing a major financial crisis in the prior year.
Resiliency
- The majority (55%) of AIAN cisgender LGB adults reported feeling connected to the LGBT community. However, only 37% of AIAN transgender adults reported feeling connected.
- About one-third (34%) of AIAN LGBT adults reported feeling connected to the AIAN community.
- About three-quarters (75%) of AIAN LGBT adults reported feeling supported through their social circles.
In addition to presenting national data, we compared AIAN-only and -multiracial LGBT and non-LGBT adults on several key outcomes by region in the U.S.: West, Midwest, South, and Northeast. Overall, patterns identified within each region reflect what we found across the U.S. Full details on the regional analyses can be found on page 37 of this report.
Download the full report