The Williams Institute estimates that there are a total of 285,000 LGBT American Indian or Alaska Native (AIAN) adults, including 56.5% that are AIAN-only and 43.5% that are AIAN in combination with at least one other race. These estimates were derived by multiplying the percentage of AIAN adults who identify as LGBT by the number of AIAN adults in each region of the U.S. More specifically, we produced estimates separately for two groups of AIAN adults, AIAN-only and AIAN-in combination with at least one other race, and added them together by region. Information about the percentage of AIAN adults who identify as LGBT, and the regional distribution of this population, was derived from the Gallup Daily Tracking survey, and population counts were based upon US Census population projections.
The Gallup Daily Tracking survey is an annual list-assisted random digital dial (70% cell phone, 30% landline) survey, conducted in English and Spanish, of approximately 350,000 U.S. adults ages 18 and up who reside in the 50 states and the District of Columbia. Between June 30, 2012, when an LGBT-identity question was first added to the Daily Tracking Survey, and December 31, 2017, 5.5% of adults who only identified their race as AIAN and 6.7% of adults who identified their race as AIAN in combination with at least one other race (e.g., White, Black or African American, Asian, Native Hawaiian or Other Pacific Islander, or self-identified ‘Other’ race) and/or Latino/a or Hispanic ethnicity, answered “yes” to the question “Do you, personally, identify as lesbian, gay, bisexual, or transgender?” These respondents were counted as LGBT. All proportions were weighted using Gallup poststratification state sampling weights.
To derive the estimated number and location of the LGBT AIAN respondents, the percentage of AIAN respondents who identified as LGBT was applied to Census projections of the U.S. 2017 Population Estimates (as of July 1, 2017). The number of adults who identified as AIAN ‘alone or in combination’ (n=4,792,150) (AIAN-plus) was obtained from American Fact Finder “Annual Estimates of the Resident Population by Sex, Age, Race Alone or in Combination, and Hispanic Origin for the United States and States: April 1, 2010 to July 1, 2017” and the number of adults who identified as AIAN-only (n=2,934,980) was obtained from American Fact Finder “Annual Estimates of the Resident Population by Sex, Age, Race, and Hispanic Origin for the United States and States: April 1, 2010 to July 1, 2017.” The number of AIAN-plus adults was hand calculated by subtracting the number of “AIAN-only” adults from the number of “AIAN alone or in combination” adults (resulting in an estimate of 1,857,170).
Applying the percentage of adults identifying as LGBT among AIAN-only and AIAN-in combination with at least one other race adults to the respective population estimates, and rounding to the nearest 1,000, we estimated a total of 285,000 LGBT AIAN adults, including:
- 161,000 LGBT AIAN-only adults (5.5% of 2,934,980, rounded to the nearest 1,000)—56.5% (161,000/285,000) of all LGBT AIAN.
- 124,000 LGBT AIAN-in combination with at least one other race adults (6.7% of 1,857,170, rounded to the nearest 1,000)—43.5% (124,000/285,000) of LGBT AIAN.
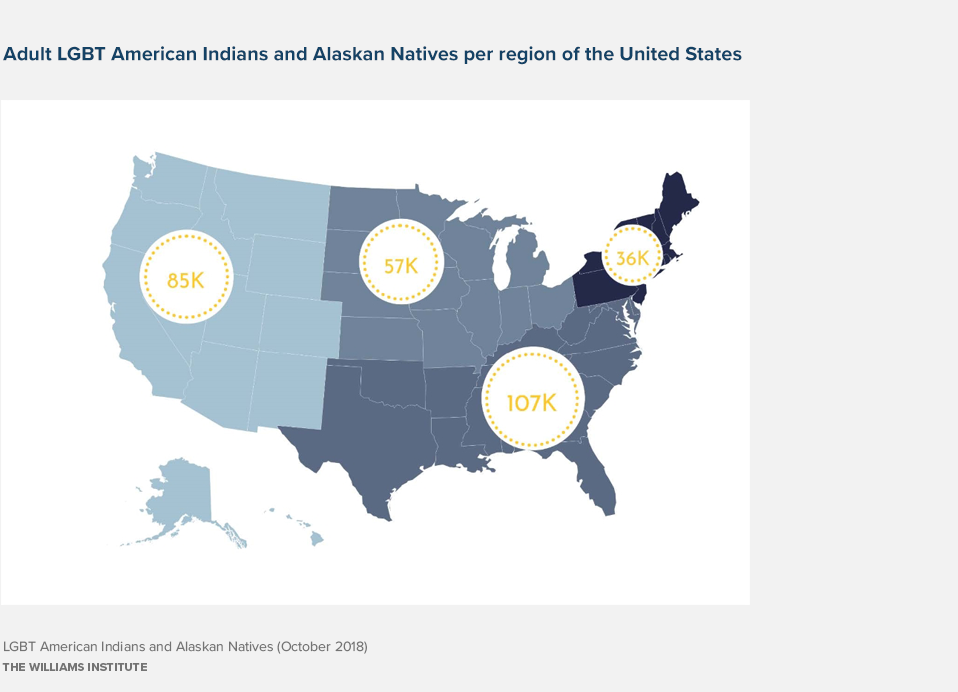
For each group of LGBT AIAN respondents, we then computed the weighted percentage in each Census region, applied this proportion to the estimated number of AIAN LGBT adults per group (AIAN-only and AIAN-in combination with at least one other race), and rounded this number to obtain estimates of the number of LGBT AIAN in each region. We then summed the resulting estimates across both AIAN groups per Census region.
