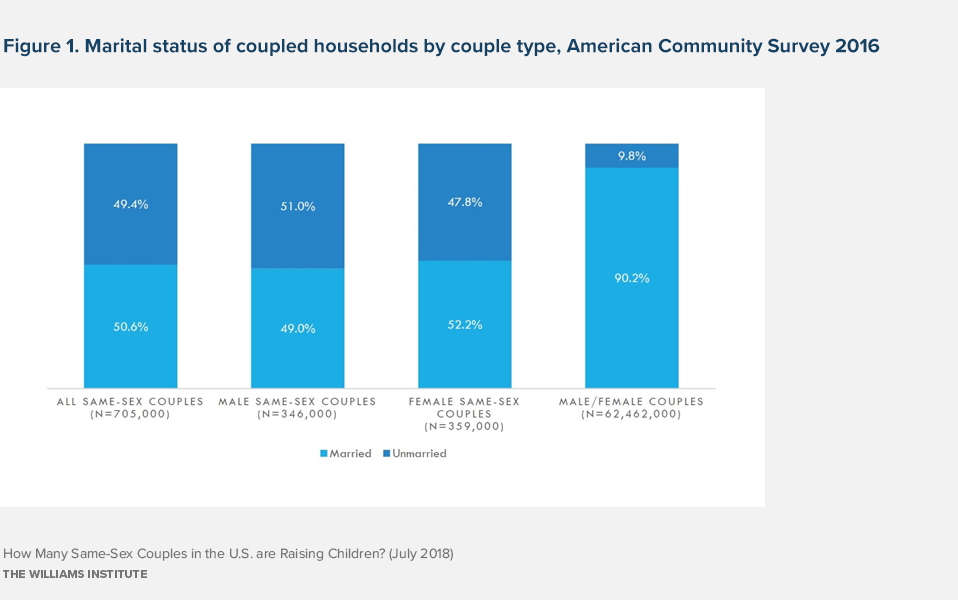
In 2016, an estimated 705,000 United States households were headed by a same-sex couple (1.1% of all coupled household), including 346,000 male same-sex couples and 359,000 female same-sex couples. Approximately half of these same-sex households included married couples (approximately 357,000); the remaining half (approximately 348,000) were unmarried cohabitating couples. In comparison, over 90% of different-sex (i.e., male/female) cohabitating couples were married (Figure 1).
How Many Same-Sex Couples in the US are Raising Children?
Using data from the 2014-2016 American Community Survey, this report provides estimates of the number of same-sex parents in the U.S. by gender and marital status.
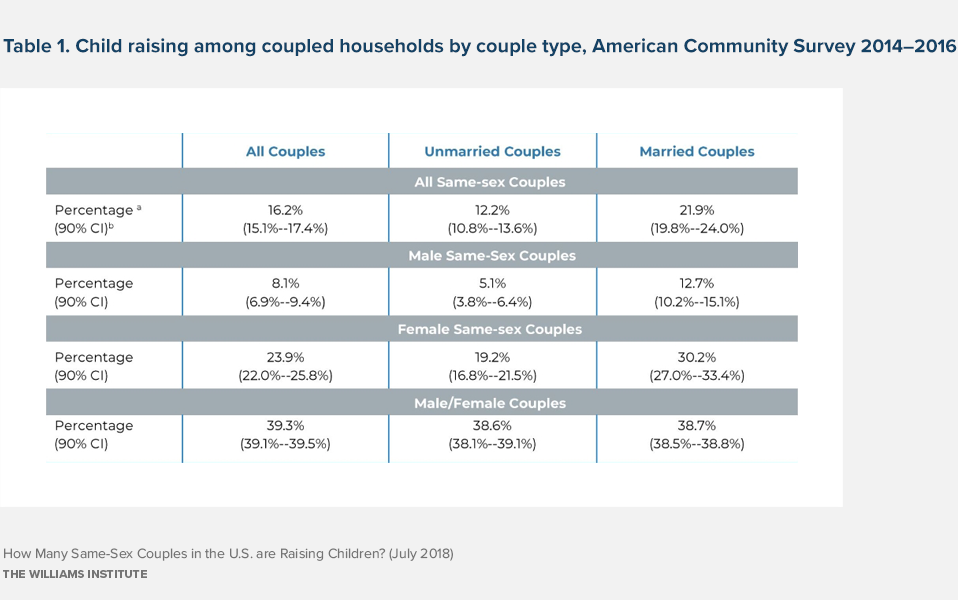
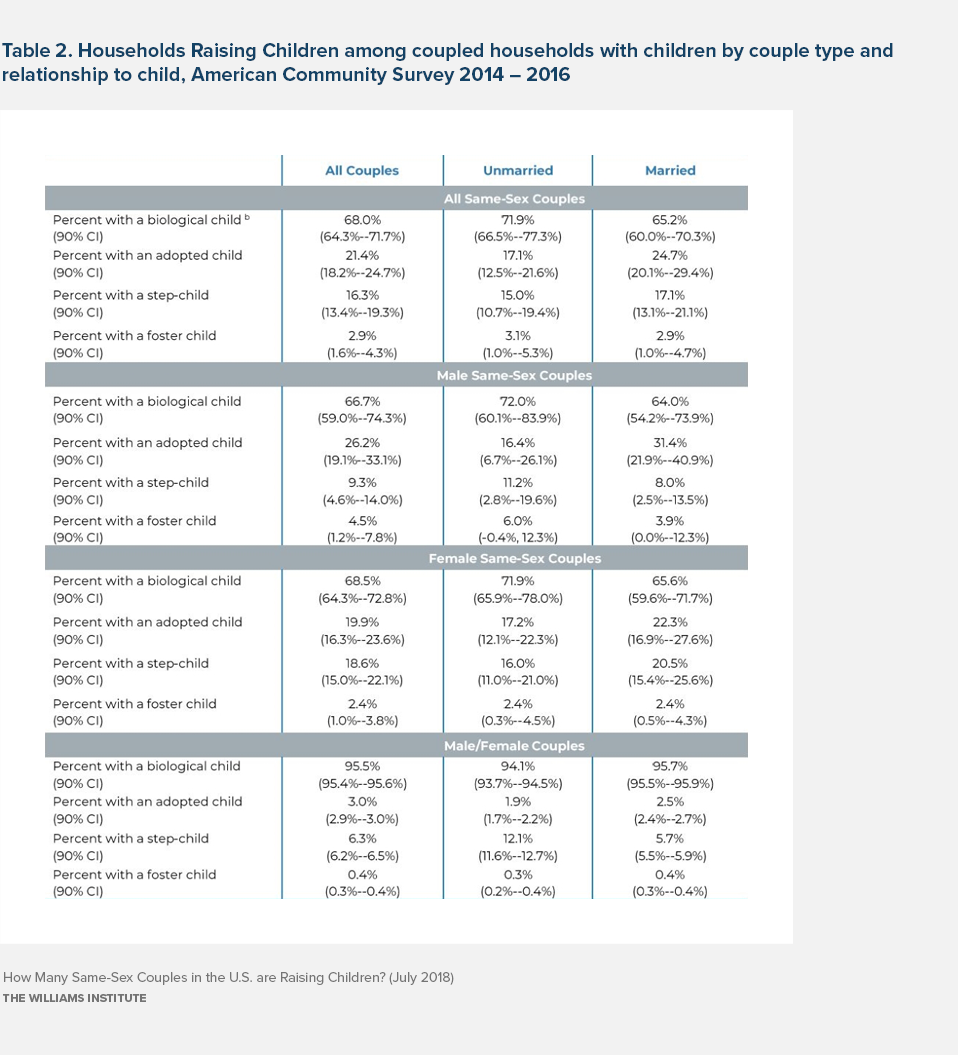
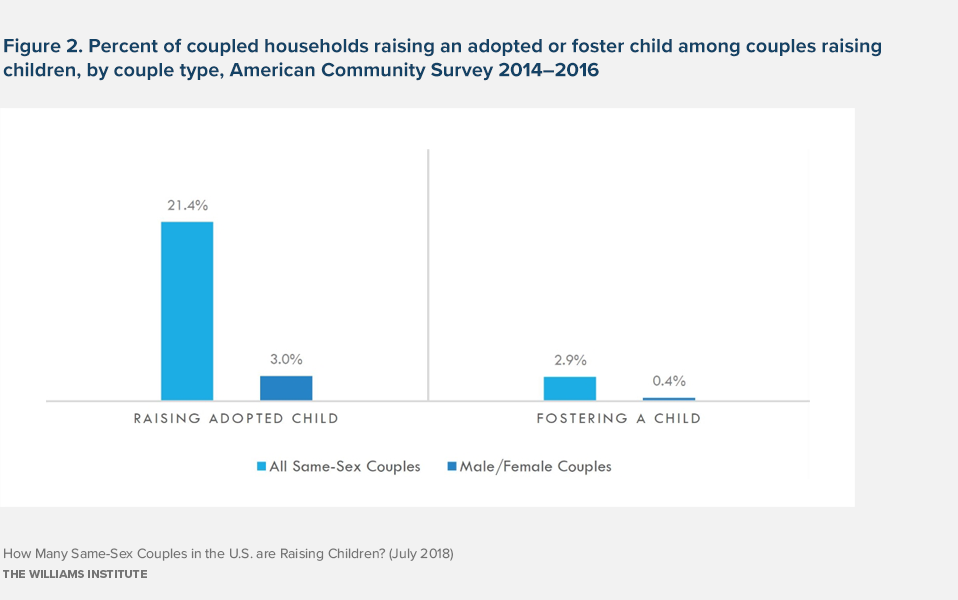
Between 2014 and 2016, 16.2% of all same-sex couples, 8.1% of same-sex male couples and more than one in five same-sex female couples were raising children, with higher rates of childrearing among married same-sex couples (Table 1). Based on 2016 household counts, there were an estimated 114,000 same-sex couples raising children in 2016, including 28,000 male same-sex couples and 86,000 female same-sex couples (not shown). Like male/female couples with children, the majority (68.0%) of same-sex couples with children were raising biological children. However, same-sex couples with children were far more likely than male/female couples with children to have an adopted child (21.4% versus 3.0%) and/or a foster child (2.9% versus 0.4%) (Figure 2; Table 2). Married male same-sex couples with children were the most likely of all couples with children to be raising adopted and foster children (Table 2).

a. Percentages are averaged across the weighted 2014, 2015, and 2016 American Community Survey data and counts may not sum to totals due to rounding. Three-year averages for % raising a child were used to produce more stable prevalence estimates across couple types.
b. 90% confidence intervals [CI] are weighted averages of the 2014, 2015, and 2016 hand calculated confidence intervals, following procedures to derive approximate standard errors, margins of errors, and CI as outlined in the endnotes. CI were computed separately for each year of data and then averaged across three years of data to derive final 90% CI.

a. For the purposes of this brief, ‘children’ included household residents below the age of 18 with a relationship to the primary householder of biological child, step-child, adopted child, or foster child of the primary householder.
b. Percentages may exceed 100% as households may have multiple children and types of children (biological, adopted, step, foster) under the age of 18. Percentages are averaged across the 2014, 2015, and 2016 weighted American Community Survey data. 90% confidence intervals [CI] are weighted averages of the 2014, 2015, and 2016 hand calculated confidence intervals, following procedures to derive approximate standard errors, margins of errors, and confidence intervals outlined in endnote 1. CI were computed separately for each year of data and then averaged across three years of data to derive final 90% CI.
The American Community Survey (ACS) is an annual survey conducted by the U.S. Census Bureau. Each year, approximately 3.54 million households and group quarters are surveyed across all 50 states, the District of Columbia, and Puerto Rico, which represent over 98% of all households and group quarters in the United States/Puerto Rico. (For more information on ACS Methodology, see here and here.) When completing the survey, one person in each household, known as the primary householder, fills out a survey for the entire household. This includes a household roster, which lists everyone who currently lives in the house, along with the sex and age of each individual and their relationship to the primary householder. “Coupled” households are defined as those where the primary householder states that another adult in the house is either their “husband/wife” or “unmarried partner.”
Household weights provided with the ACS dataset enable the generation of prevalence percentages that are representative of U.S. households, as well as estimates of numbers of households (which we round to the nearest 1,000). We wish to note that the counts and percentages included in this brief will not match those reported by the Census Bureau/American Fact Finder for two reasons. Firstly, the publicly available ACS IPUMS dataset is a sample of the full ACS dataset (for more information see here) Secondly, we excluded couples that may have been incorrectly classified as same-sex couples (see Gates and Cooke, 2011; O’Connell and Feliz, 2011) using an adjustment procedure recommended in the seminal work of demographer Gary Gates (see Carpenter and Gates, 2008) for example). This involves deleting couples who had the sex and/or marital status of the householder and/or their spouse/partner reassigned (referred to as ‘reallocated’) by the Census Bureau during routine data cleaning, as well as deleting couples who appeared to be same-sex couples, but reported a year of marriage prior to 2004, the first year in which same-sex couples were allowed to legally marry in the U.S. These adjustments result in excluding approximately 19.3% (weighted) of same-sex couples (those most likely to be incorrectly coded as a same-sex couple in the ACS) and 1.4% of different-sex couples. Thus, our estimates of same-sex couples are conservative. In addition, our estimates of same-sex cohabitating couples will differ from other estimates of same-sex couples derived from other samples and from estimates that use different measures.
Data analyzed for this brief include the 2014, 2015, and 2016 American Community Survey (ACS) single-year Public Use Microdata Sample (PUMS), obtained 6/27/18 from the Integrated Public Use Microdata Series (IPUM) Version 7.0 (Steven Ruggles, Katie Genadek, Ronald Goeken, Josiah Grover, and Matthew Sobek. Integrated Public Use Microdata Series: Version 7.0 American Community Survey 2014 [and 2015, and 2016] Sample. Minneapolis, MN: University of Minnesota, 2017. https://doi.org/10.18128/D010.V7.0)
To account for small sample sizes/lower reliability of estimates derived from a single year, estimates of childrearing were derived from an aggregated sample of three years of the ACS (2014, 2015, and 2016); estimates of household counts (e.g. N/% of same-sex households) were derived from the 2016 ACS solely; all data were obtained from the IPUMS website as noted above. To further account for potential error, we hand calculated approximate standard errors, margins of error, and 90% confidence intervals for all percentages, following procedures recommended in the PUMS Technical Briefs (Public Use Microdata Sample (PUMS) Accuracy of the Data (2016) “Approximating Generalized Standard Errors with Design Factors Totals and Percentages”) separately for each individual year of data. We then averaged the resulting percentages, and lower/upper 90% confidence interval across the three years, to derive the final estimates reported in Table 2 and Figure 2.
For the purposes of this brief, ‘children’ included household residents below the age of 18 with a relationship to the primary householder of biological child, step-child, adopted child, or foster child of the primary householder
Estimated counts were derived by applying the percentages and 90% CI reported above to 2016 weighted household counts (by sex and couple type) and rounded to the nearest 1,000. For example, in the 2016 ACS, there were an estimated (rounded to the nearest 1,000) 705,000 same-sex couple households. Applying the 2014-2016 ACS average percentage of same-sex households raising children (16.2%, 90% CI: 15.1%–17.4%) and rounding to nearest 1,000, we derive an estimated count of 114,000 same-sex households, and a 90% CI range of 106,000-123,000 same-sex households. For males, applying the same approach for the average percentage of male same-sex households raising children (8.1%; 90% CI: 6.9%-9.4%) to the 2016 number of male same-sex households (n=346,000), we derive an estimate of 28,000 male same-sex households, and a 90% CI range of 24,000-32,000. For females, applying the average percentage of female same-sex households raising children (23.9%; 90% CI: 22.0%-25.8%), to the 2016 number of female same-sex households (n=359,000), we derive an estimate of 86,000 female same-sex households, and a 90% CI range of 79,000-93,000.

