Executive Summary
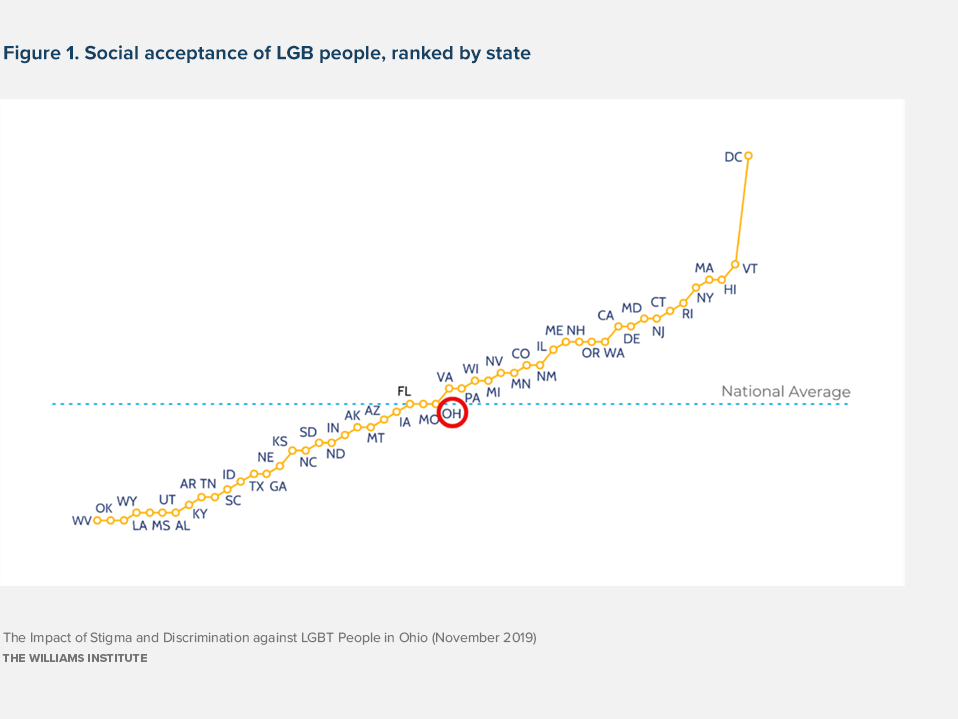
Ohio is home to an estimated 389,300 LGBT adults and 72,300 LGBT youth. LGBT people in Ohio lack important legal protections that have been extended in other states. For example, statewide statutes in Ohio do not explicitly prohibit discrimination based on sexual orientation or gender identity in areas such as employment, housing, and public accommodations. State laws in Ohio also fail to adequately protect LGBT students from bullying and harassment. In terms of social climate, Ohio ranks 25th in the nation on public support for LGBT rights and acceptance of LGBT people.
The legal landscape for LGBT people in Ohio likely contributes to an environment in which LGBT people experience stigma and discrimination. Stigma and discrimination can take many forms, including discrimination and harassment in employment and other settings; bullying, harassment, and family rejection of LGBT youth; overrepresentation in the criminal justice system; and violence. Research has linked stigma and discrimination against LGBT people to negative effects on individuals, businesses, and the economy.
In this study, we provide data and research documenting the prevalence of several forms of stigma and discrimination against LGBT adults and youth in Ohio, including discrimination and harassment in employment, housing, and public accommodations; bullying and harassment in schools; and family rejection of LGBT youth. We discuss the implications of such stigma and discrimination on LGBT individuals, in terms of health and economic security; on employers, in terms of employee productivity, recruitment, and retention; and on the economy, in terms of health care costs and reduced productivity.
To the extent that Ohio is able to move toward creating a more supportive environment for LGBT people, it would likely reduce economic instability and health disparities experienced by LGBT individuals, which, in turn, would benefit the state, employers, and the economy.
Key Findings
Prevalence of Stigma and Discrimination against LGBT People
LGBT people in Ohio experience discrimination in employment, housing, and public accommodations.
- A 2016 survey of faculty, staff, and students at Kent State University found that LGBQ faculty were more likely than heterosexual faculty to say that they were uncomfortable with the climate in their department (23% v. 16%). LGBQ faculty and staff were also more likely to say that they were reluctant to bring up issues that concerned them out of fear that it would negatively impact their job (45% v. 35%) and to say that they have to work harder than their colleagues to achieve the same recognition (46% v. 37%). Among staff, LGBQ respondents were more likely than heterosexual respondents to say that they disagreed with the statement that senior administration is genuinely concerned with their welfare (40% v. 27%).
- The 2015 U.S. Transgender Survey found that of transgender respondents from Ohio who held or applied for a job in the prior year, 30% reported being fired, being denied a promotion, or not being hired for a job because of their gender identity or expression. In terms of housing discrimination, 25% of respondents from Ohio reported experiencing some form of housing discrimination in the past year, such as being evicted from their home or denied a home or apartment because of being transgender, and 15% reported that they experienced homelessness in the past year because of being transgender. In addition, of those respondents who visited a place of public accommodation where staff or employees knew or thought they were transgender, 32% experienced at least one type of mistreatment in the past year because of being (or being perceived to be) transgender.
- A 2014 community survey of LGBT people in Dayton found that a number of people had experienced discrimination based on their sexual orientation and gender identity. One-third
(34%) of respondents said they had been denied an employment opportunity, 29% said they had been treated differently at a place of public accommodation, 16% said they had been treated unfairly by a health care provider, and 11% said they had been denied an opportunity to rent or purchase a home because of their sexual orientation or gender identity.
- In response to a 2016 poll, 57% of Ohio residents, both LGBT and non-LGBT, said that they thought that gay and lesbian people experience a lot of discrimination in the U.S., and 61% of Ohio residents said that they thought that transgender people experience a lot of discrimination in the U.S.
- Analysis of aggregated public opinion data collected from 2011 through 2013 found that 79% of Ohio residents thought that LGBT people experience discrimination in the state.
- Discrimination against LGBT people in Ohio has also been documented in a number of court cases and the media. Instances of employment discrimination documented in these sources involve private and public sector workers in a range of occupations. Examples of discrimination in housing and public accommodations have also been documented in these sources.
LGBT youth in Ohio experience bullying and harassment at school.
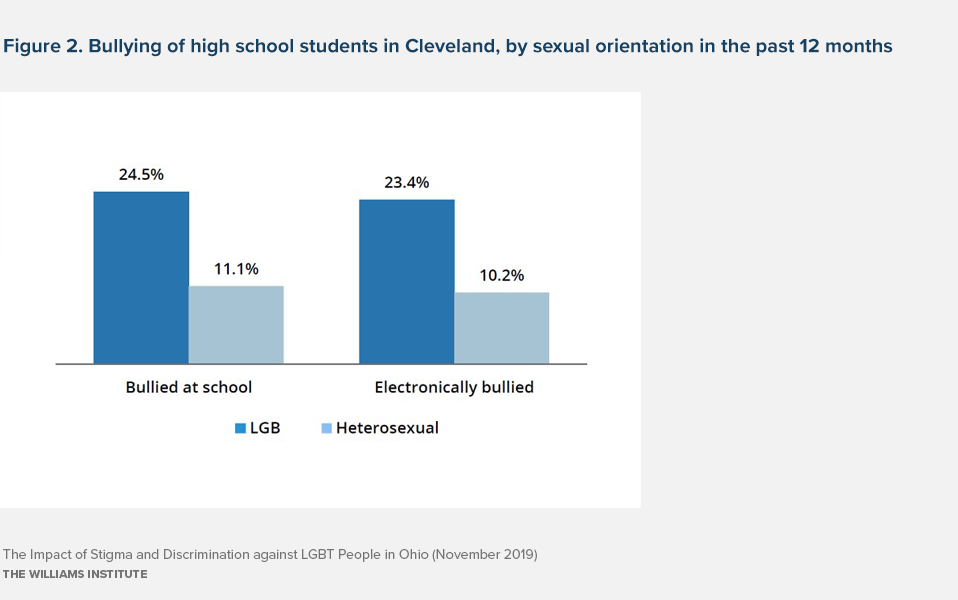
- The 2017 Youth Risk Behavior Surveillance Survey found that LGB students in Cleveland were more than twice as likely to report being bullied at school (24.5% v. 11.1%) and electronically bullied (23.4% v. 10.2%) in the year prior to the survey than heterosexual students.
- In addition, LGB students in Cleveland were more likely than heterosexual students to report missing school because they felt unsafe at least once in the month prior to the survey (15.5% v. 7.5%).
- The 2017 GLSEN National School Climate Survey of LGBTQ middle- and high-school students found that 73% of respondents from Ohio said they had experienced verbal harassment based on their sexual orientation at school, and 60% said they had experienced verbal harassment based on their gender expression at school in the year prior to the survey. Many students also reported experiencing physical harassment based on their sexual orientation (30%) or gender expression (26%) at school in the year prior to the survey.
- The 2015 U.S. Transgender Survey found that 57% of survey respondents from Ohio who were perceived to be transgender while in grades K-12 reported experiencing verbal harassment, 27%reported experiencing physical assault, and 15% reported experiencing sexual violence while in school.
- A 2016 survey of students, faculty, and staff at Kent State University found that trans spectrum respondents (including transgender, non-binary, and other gender minority respondents) were more likely to report problems on campus than cisgender men and women students. For example, among all respondents (students, faculty, and staff), 39% of trans spectrum respondents said that they had experienced exclusionary, intimidating, offensive or hostile conduct on campus compared to 17% of cisgender women respondents and 15% of cisgender men respondents. Over half (54%) of trans spectrum respondents who had these experiences said the exclusionary conduct was because of their gender identity.
Impact of Stigma and Discrimination on LGBT Individuals
LGBT people in Ohio experience economic instability.
- Stigma and discrimination against LGBT workers can lead to economic instability, including lower wages and higher rates of poverty.
- Gallup polling data from 2015-2017 show that 33% percent of LGBT adults in Ohio reported that they did not have enough money for food compared to 16% of non-LGBT adults in the state. And, 33% of LGBT adults in Ohio reported having a household income below $24,000, compared to 21% of non-LGBT adults. In addition, 11% of LGBT adults in Ohio reported being unemployed, compared to 5% of non-LGBT adults.
- The 2015 U.S. Transgender Survey found that 16% of transgender respondents in Ohio were unemployed and 26% were living in poverty. In addition, 15% experienced homelessness in the past year because of being transgender.
LGBT adults and youth in Ohio experience health disparities.
- Research indicates that stigma and discrimination contribute to adverse health outcomes for LGBT adults such as major depressive disorder, binge drinking, substance use, and suicidality. Similarly, bullying and family rejection, as well as social stigma more broadly, have been linked to an increased likelihood of school dropout, suicide, and substance use among LGBT youth.
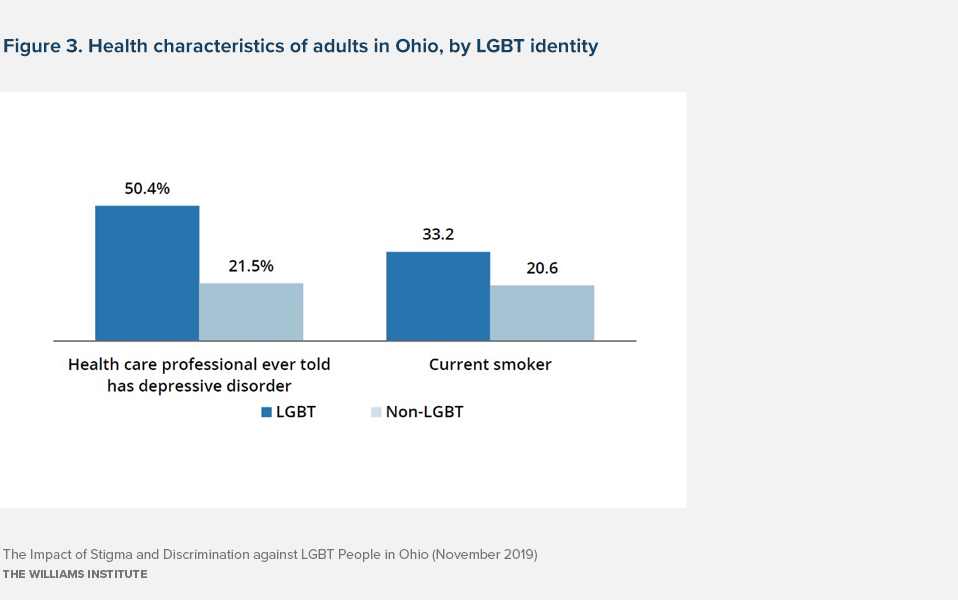
- LGBT adult respondents to the 2017 Ohio Behavioral Risk Factor Surveillance System survey were significantly more likely to have been diagnosed with a depressive disorder by a health care professional than non-LGBT respondents (50.4% v. 21.5%). In addition, LGBT adults in Ohio were significantly more likely to report current smoking (33.2% v. 20.6%) than non-LGBT adults.
- The 2017 Youth Risk Behavior Survey found that LGB students in Cleveland were more likely than heterosexual students to report that they have seriously considered suicide (36.1% v. 15.4%) and have attempted suicide (31.2% v. 16.6%) in the year prior to the survey. LGB students in Cleveland were also more likely than heterosexual students to report smoking cigarettes (15.0% v. 5.0%), drinking (41.3% v. 23.7%), and using marijuana (38.2% v. 23.4%) in the month prior to the survey.
Economic Impacts of Stigma and Discrimination
Discrimination against LGBT people in employment and other settings has economic consequences for employers and the state government.
- Productivity. Unsupportive work environments can mean that LGBT employees are less likely to be open about their sexual orientation or gender identity at work, and more likely to be distracted, disengaged, or absent, and to be less productive. These outcomes could lead to economic losses for state and local governments, as employers, as well as for private-sector employers in the state. Given that an estimated 298,000 workers in Ohio identify as LGBT, the loss in productivity from a discriminatory environment could be significant.
- Retention. LGBT employees in less supportive work environments feel less loyal to their employers and are more likely to plan to leave their jobs. Given the average replacement costs of an employee, public and private employers risk losing $9,640, on average, for each employee that leaves the state or changes jobs because of an unsupportive environment in Ohio.
- Recruitment. Many LGBT and non-LGBT workers, in particular those who are younger and more highly educated, prefer to work for companies with more LGBT-supportive policies, and in states with more supportive laws. To the extent that workers from other states perceive Ohio to be unsupportive of LGBT people, it may be difficult for public and private employers in the state to recruit talented employees from other places.
Bullying, harassment, and family rejection of LGBT youth negatively impact the economy.
- Bullying, harassment, and family rejection of LGBT youth can cause them to miss or drop out of school, become homeless, or become unemployed or underemployed.
- In response to the 2015 U.S. Transgender Survey, of those respondents from Ohio who said they had been harassed in school, 20% said the harassment was so severe that they had to leave school.
- School drop-out and homelessness that arise due to bullying, harassment, and family rejection are harmful not only to individual LGBT youth but also have societal consequences in that they reduce the capacity of these youth to contribute to the economy as adults.
- In addition, school-based harassment and family rejection can increase costs to the state via Medicaid expenditures, incarceration, and lost wages. The Jim Casey Foundation has estimated that homelessness, juvenile justice involvement, and poor educational and employment outcomes cost nearly $8 billion per cohort that ages out of foster care each year in the U.S. The best available data suggest that LGBT youth make up one-fifth, if not more, of each annual aging out cohort.
Health disparities for LGBT people negatively impact the economy.
- A more supportive legal landscape and social climate for LGBT people in Ohio is likely to reduce health disparities between LGBT and non-LGBT people, which would increase worker productivity and reduce health care costs.
- We estimate that reducing the disparity in major depressive disorder between LGBT and non-LGBT people in Ohio by 25% to 33.3% could benefit the state’s economy by $155.9 million to $207.9 million, and reducing the disparity in current smoking by the same proportion could benefit the state’s economy by $104.4 million to $207.9 million in increased productivity and reduced health care costs each year. To the extent that a more supportive legal landscape would reduce other health disparities, the state’s economy would benefit even more.