Introduction
Data that allow for analyses of the geographic distribution of the lesbian, gay, bisexual, and transgender (LGBT) population across geographic areas in the United States have only very recently become available. In 2012, Gallup added a question to its Daily Tracking survey, which interviews approximately 1,000 adults in the US every night and asks respondents, “Do you, personally, identify as lesbian, gay, bisexual, or transgender?” Since then, more than 374,000 adults have been interviewed. These data now provide sufficient sample sizes to estimate the proportion of adults who identify as LGBT by state and, most recently, by large metropolitan areas.
The lack of historical data that identify LGBT individuals makes assessments of how the geographic patterns of the LGBT population in the US have changed over time difficult. However, data from the US Census that identifies same-sex couples have been available since 1990. The 1990 Census data represent the earliest historical data with sufficient sample sizes to consider geographic patterns of at least a subset of the LGBT population, same-sex couples who are residing together in the same household.
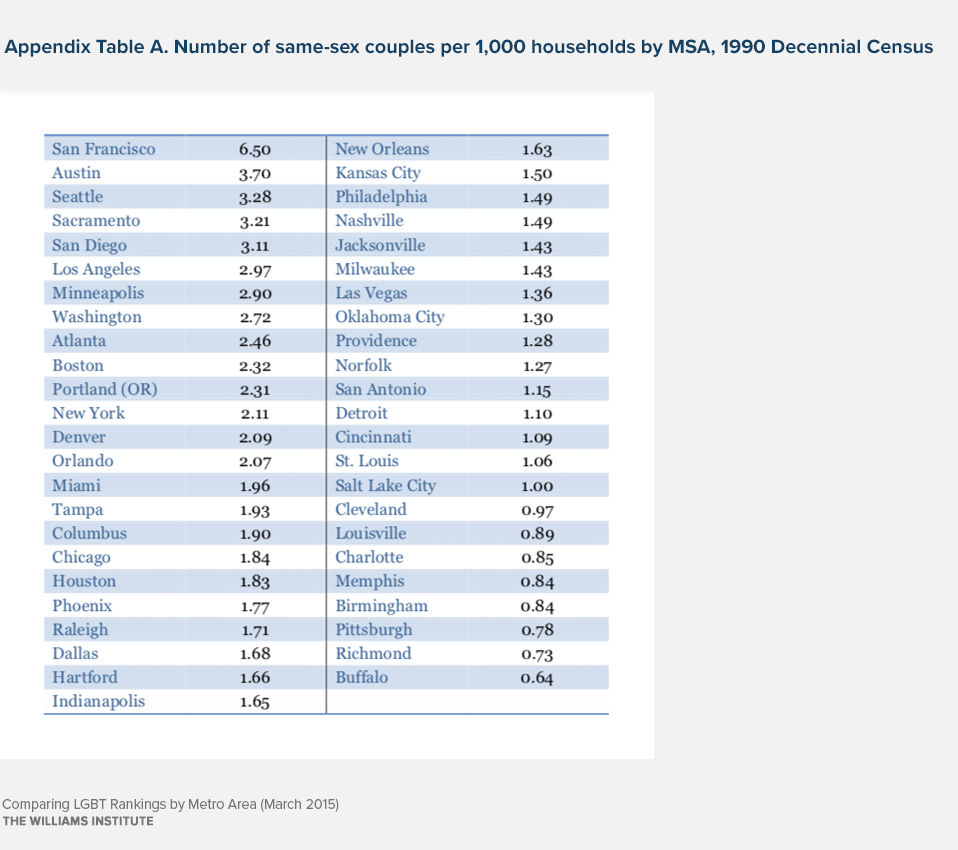
These analyses compare rankings of the most populous metropolitan areas derived from the 2012-2014 Gallup Daily tracking data with rankings derived more than twenty years ago from 1990 US Census data. The Census data are used to rank metro areas by the number of same-sex couples per 1,000 households and the Gallup data rank them by the proportion of adults who identify as LGBT.
Results
The rankings compare two different measures: the proportions of cohabiting same-sex couples and the proportions of adults who identify as LGBT. While measures of same-sex couples and LGBT identity are not strictly comparable, studies do show that geographic patterns of same-sex couples are similar to those of the LGBT population. For example, comparing rankings of states by the proportion of same-sex couples using Census 2010 data to rankings of states by the percent of adults who identify as LGBT using Gallup data, the top ten states in both rankings have seven states in common while the ten lowest-ranked states have six states in common.
These analyses rank 47 large Metropolitan Statistical Areas (MSAs) that can be matched in the two data sources. MSA definitions are not completely consistent between 1990 and 2012/2014. In the 1990 data, San Jose is included in the San Francisco MSA, Riverside is included in the Los Angeles MSA, and Baltimore is part of the Washington, DC MSA. The Gallup analyses reported rankings of the fifty largest MSAs that included San Jose, Riverside, and Baltimore. Because comparisons are not available for 1990, these three MSAs are excluded in the findings presented here.
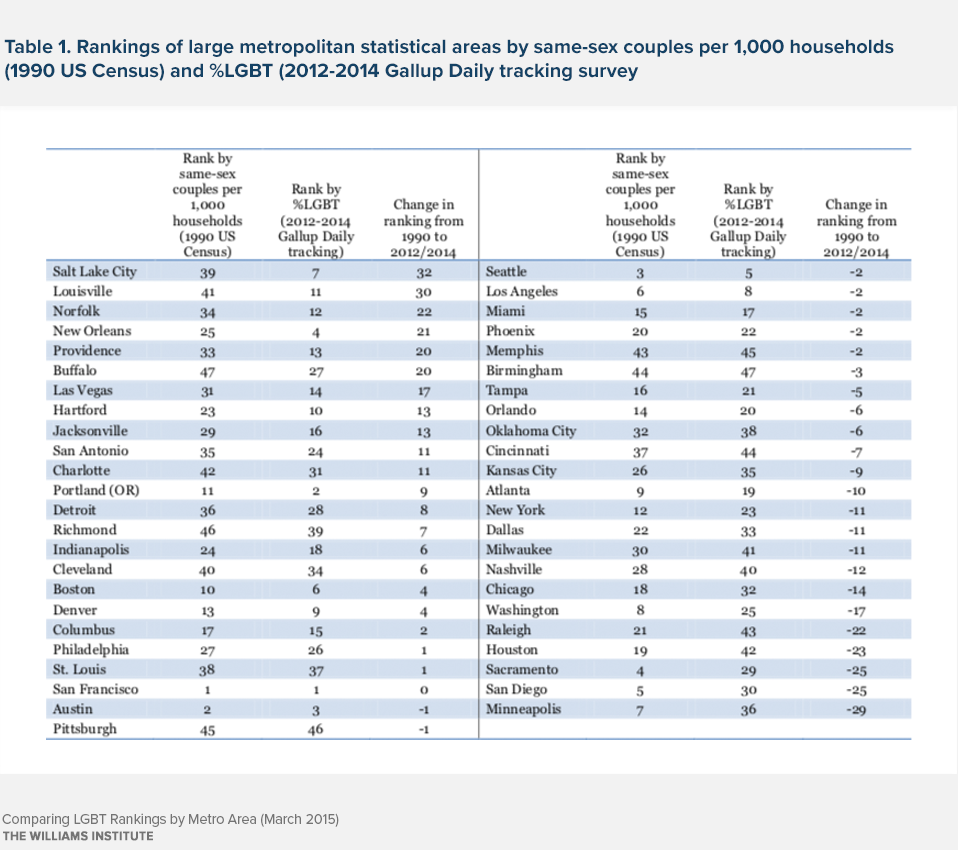
Three metro areas are in the top five of the 1990 Census same-sex couple rankings and the 2012-2014 Gallup LGBT rankings: San Francisco, Austin, and Seattle. The Gallup top five MSAs are San Francisco, Portland (OR), Austin, New Orleans, and Seattle. In the 1990 Census rankings, the top five MSAs are San Francisco, Austin, Seattle, Sacramento, and San Diego.
The five lowest-ranked metro areas also have three MSAs common to both lists: Memphis, Pittsburgh, and Birmingham. Raleigh and Cincinnati round out the bottom five in the Gallup rankings while Richmond and Buffalo are in the bottom five in the 1990 Census rankings.
While there are clear similarities between the 1990 and 2012-2014 rankings, several MSAs are notable for ranking quite differently in the two lists (see Table 1). Salt Lake City ranked 39th in the 1990 rankings and 7th in the 2012-2014 data. Other MSAs with substantially higher rankings in the 2012-2014 data compared to the 1990 data were Louisville, Norfolk, New Orleans, and Providence. Minneapolis had the largest change in rankings in the other direction, from 7th in 1990 to 36th in the 2012-2014 data. Other MSAs with substantially lower rankings in 2012-2014 compared to 1990 were San Diego, Sacramento, Houston, and Raleigh.

