Report

Jacksonville-Area Community Assessment

June 2018

This study analyzes data from the largest survey of LGBTI adults ever conducted in Northeast Florida. It examines the composition, experiences, and needs of the LGBTI community and provides recommendations to improve the health and well-being of this population.

AUTHORS
Highlights
Three-quarters of respondents reported facing “everyday discrimination,” such as being disrespected, threatened, or harassed, in the last year.
Nearly all sexual minority respondents reported being out to someone.
Many respondents reported lifetime experiences of employment discrimination.
Data Points
75%
of respondents reported experiences of everyday discrimination in the past 12 months
20%
of respondents reported being fired unfairly from a job
36%
reported being passed over for a job for which they were qualified
28%
of sexual minority respondents were not out to their bosses or supervisors
49%
of Black sexual minority respondents were not out to their bosses or supervisors
63%
of respondents reported being in a partnered relationship
43%
of respondents were married
Report

Executive Summary

The Jacksonville-Area Community Assessment was initiated to learn about the composition, experiences, and needs of Northeast Florida’s large and diverse lesbian, gay, bisexual, transgender, and intersex (LGBTI) community. Between August and November 2017, 671 LGBTI adults who lived, worked, prayed, played, or received services in Jacksonville in the prior year completed anonymous, English-language surveys. Nearly all surveys were completed online. Information about the survey was distributed across Northeast Florida by four outreach assistants and members of the Community Advisory Board assembled to guide this project. Survey respondents were diverse by age, sex, gender, race, sexual orientation, and gender identity, among other characteristics. Two thirds (65.6%) had lived in one of the five counties of Northeast Florida for more than 10 years. 

Demographics

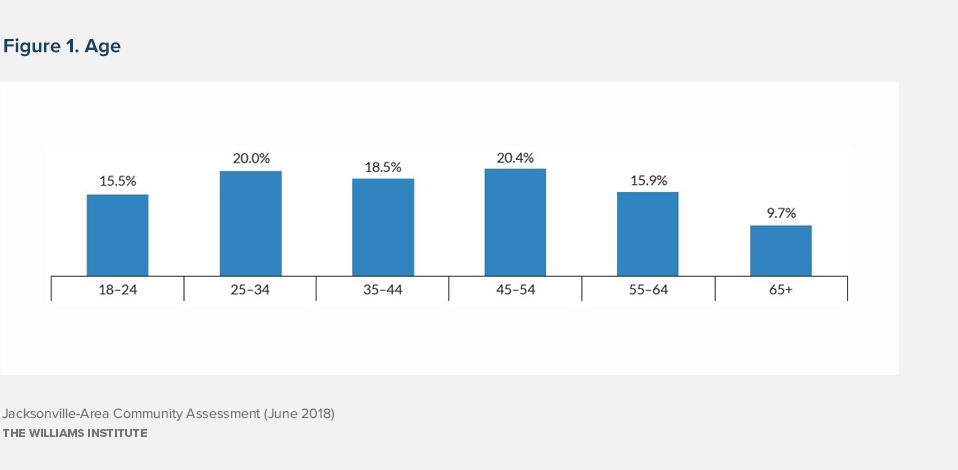
  • As shown in Figure 1, respondents were young, middle-aged, and older.
  • As shown in Figure 2, most (71.8%) respondents were white, 13.5% were black or African American (hereafter African American), 8.1% were Hispanic or Latino/a, 4.6% were more than one race or multiracial, and 2.1% were Asian, Pacific Islander, or another race-ethnicity.
  • Similar proportions of respondents were assigned female sex at birth as male (47.5% and 50.9%, respectively), with 1.6% of respondents identifying as intersex.
  • Approximately 13.5% of respondents were gender minorities (individuals whose current gender identity differs from their sex assigned at birth) and the majority (86.5%) was cisgender (individuals whose current gender identity and assigned sex at birth is the same).
  • A majority (70.4%) of respondents identified as lesbian or gay, 17.6% identified as bisexual, 9.6% as queer, 1.3% as asexual, and 1.0% as straight.

Socioeconomic Characteristics

  • Many respondents reported high levels of formal educational attainment; over half (56.4%) had a bachelor’s, graduate or professional degree, and about one in ten (9.4%) respondents had a high school or GED diploma.
  • Approximately three quarters (74.3%) of respondents were employed for wages or self-employed; 11.0% were retired, 6.1% were students, 4.6% were out of work, 2.8% were unable to work, and 1.0% were homemakers.
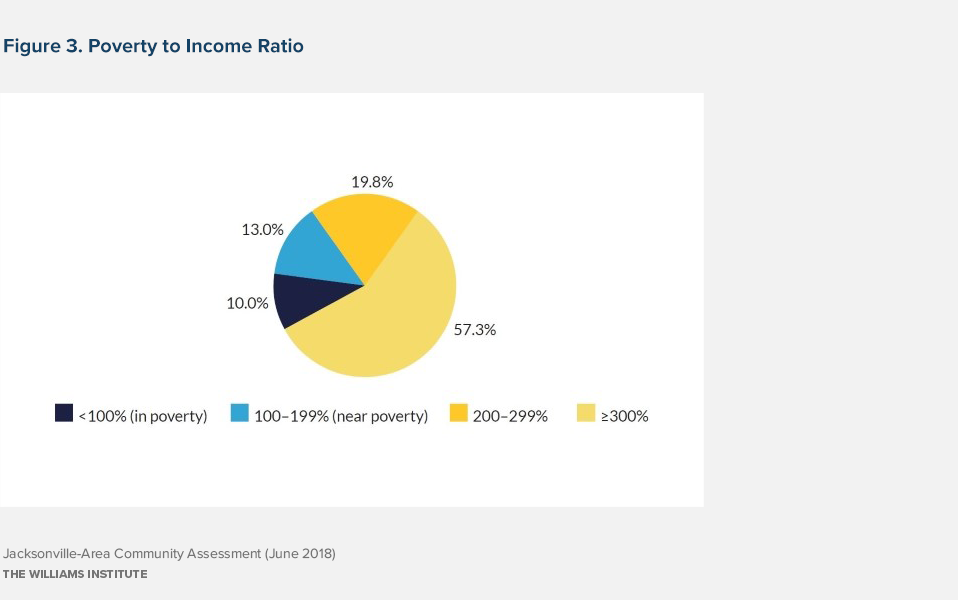
  • As shown in Figure 3, although nearly a quarter (24.3%) of respondents reported annual household incomes of $100,000 or more, 10% of respondents were living in poverty (living below 100% of the federal poverty level), and another 13.0% of respondents were “near poor” (living at 100-199% of the federal poverty level).
  • Among respondents assigned female at birth, about one quarter reported household incomes at the poverty (10.5%) or near poverty (16.0%) levels.
  • Approximately one in five (21.8%) respondents reported food insecurity in the last 12 months (cutting or skipping meals because of insufficient money for food).
  • Among gender minorities, 20.0% reported being out of work, more than half (52.2%) reported food insecurity in the last twelve months, and two-thirds reported household incomes at the poverty (32.2%) or near poverty (34.5%) levels.

Relationship and Family Characteristics

  • Over sixty percent (62.8%) of respondents reported being in “partnered” relationships; about half of cisgender respondents reported having a cisgender partner of the same sex assigned at birth, and between a fifth and a quarter of gender minority respondents reported having a gender minority partner.
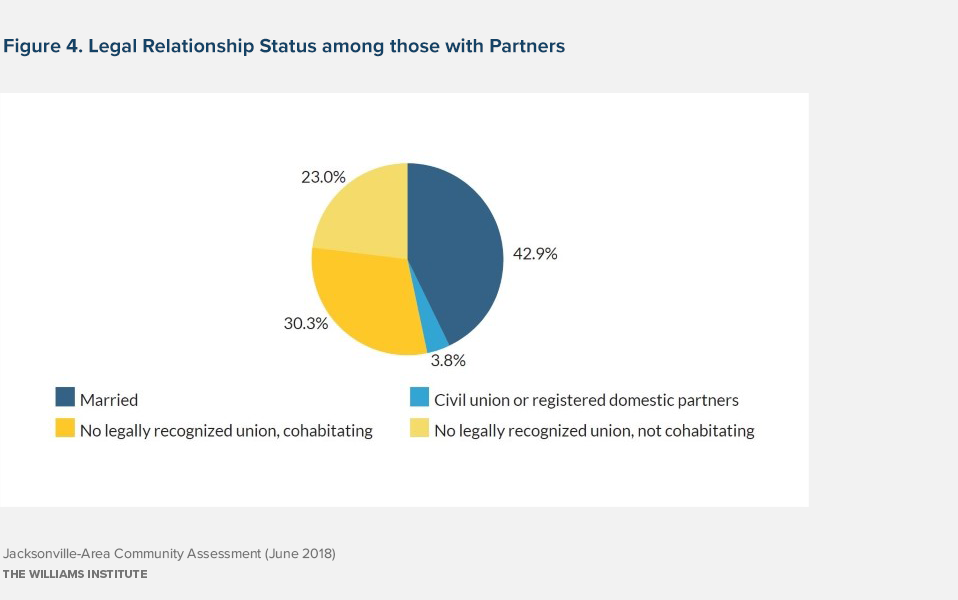
  • As shown in Figure 4, over forty percent (42.9%) of those with partners were married.
  • Almost one quarter (24.5%) of respondents reported having one or more children in their lifetimes; while 12.6% currently had a child under 18 living in their household.
  • Respondents assigned female at birth (17.3%) were more likely to have reported they currently had a child under 18 living in their household than those assigned male at birth (7.9%).
  • Nearly two out of five respondents under the age of 55 reported being somewhat likely (22.2%) or very or extremely likely (16.1%) to have children in the future. Gender minority respondents were also more likely than cisgender respondents to report being somewhat, very, or extremely likely to have children in the future (42.7% versus 27.4%).

Religion

  • Just over one quarter (26.7%) of the sample reported being a member of a local house of worship (e.g., church, synagogue, mosque, or temple), and more than four out of ten (43.3%) respondents reported that religion was somewhat or very important to them.
  • As shown in Figure 5, only 15.7% reported attending religious services at least once a week.
  • About one fifth (20.2%) of the sample reported that their religion has less than a neutral view of homosexuality, including viewing homosexuality as wrong and sinful, while 17.8% reported full acceptance of homosexuality by their religion.
  • More than half (52.3%) of African American respondents reported being members of local houses of worship, and the majority (69.4%) indicated that religion was somewhat or very important to them.
  • Weekly religious attendance was reported by a third (33.0%) of African American adults in the sample.
  • Over a quarter (28.7%) of African American respondents reported that their religion views homosexuality as wrong and sinful, and just under a quarter (24.1%) reported full acceptance of homosexuality by their religion.
  • Among older adults (ages 55 and up), 23.5% reported attending services at least once a week, and 30.4% reported that their religion was very important in their lives.

Health

  • Most (85.8%) respondents had health insurance.
  • Rates of health insurance coverage were lower among African American respondents (77.8%) compared to white respondents (88.9%), gender minority respondents (74.4%) compared to cisgender respondents (87.8%), and younger respondents (82.9%) compared to older respondents (94.2%).
  • About half (54.2%) of respondents reported very good or excellent health.
  • Among gender minorities, 42.2% reported poor or fair health.
  • More than one third (34.2%) of respondents reported a lifetime diagnosis of depression.
  • Almost sixty percent (58.4%) of gender minorities reported a lifetime diagnosis of depression.
  • As shown in Figure 6, a total of 28.3% of the sample met criteria for moderate to severe depression. Consistent with this, respondents reported that, on average, poor physical or mental health kept them from doing their usual activities on 5.9 days in the past month.
  • Nearly two thirds (64.5%) of gender minority respondents met criteria for moderate to severe depression, and poor physical or mental health kept them from doing their usual activities, on average, on 10.2 days in the past month.
  • Rates of attempted suicide were higher among gender minority respondents, 11.1% of whom reported that they tried to kill themselves at least once in the past 12 months compared to 2.6% of cisgender respondents. Reported rates of attempted suicide in the past 12 months were also higher among younger respondents (5.6%) compared to older respondents (0.0%).
  • About one in six (16.5%) of all LGBTI respondents reported being a current smoker.
  • Binge drinking in the past 30 days was reported by nearly four out of ten respondents.
  • One in four (25.0%) respondents reported using marijuana or hashish in the past 30 days. Those who reported using marijuana, on average, used marijuana 13.6 days in the past month.

Aging

  • As shown in Figure 7, most (84.0%) respondents ages 55 and older reported they had done some or a great deal of preparation for their senior years. When asked about their top concerns related to aging, not being able to take care of themselves (30.0%) and not having enough money to meet their needs (21.8%) were the two most commonly endorsed concerns.
  • Support doing maintenance on their home (50.9%), support with long-term care (46.1%), and support managing health and wellness (32.3%) were the most frequently endorsed services that respondents ages 55 and older anticipated needing as they aged.
  • Almost half (45.5%) of gender minority respondents expected needing support in exploring housing options as they aged.
  • Among respondents ages 60 and older, only 40.3% reported that they felt they could be open about their sexual orientation and gender identity with elder service organization staff.

Outness and Acceptance

  • Nearly all LGBQ respondents, including gender minority LGBQ respondents, reported being out to someone. Majorities reported that all of their LGBTI friends (78.0%) and immediate family members (69.1%) knew they are LGBQ. However, more than a fifth of LGBQ respondents reported that none of their current bosses or supervisors (27.5%), members of their faith community (22.6%), or current health care providers (21.3%) knew they are LGBQ.
  • As shown in Figure 8 below, substantial majorities of those who were “out” reported acceptance from some, most, or all of those to whom they were out.

*Denotes responses that have been suppressed because of small sample size

  • Among African American respondents, 61.7% reported that all of their LGBTI friends and 48.8% of immediate family members knew they are LGBQ. However, almost half (49.3%) of African American LGBQ respondents reported that none of their current bosses or supervisors and large proportions reported that none of the members of their faith community (39.3%) or current health care providers (27.4%) knew they are LGBQ.
  • Most gender minority respondents reported being out as transgender or other gender minority individual to at least some people across various relational groups; however, many were not out to any current boss or supervisor (44.2%) or to any members of their faith communities (36.4%).

Discrimination 

  • Approximately three quarters (74.5%) of respondents reported that they experienced at least one experience of “everyday discrimination,” such as being treated with less courtesy or respect than other people, in the past 12 months.
  • Respondents who reported everyday discrimination were most likely to indicate that these experiences were because of their sexual orientation (53.6%), sex (female or male) (36.5%), or age (28.5%).
  • As shown in Figure 9, about one in 25 respondents (3.9%) reported being fired unfairly from a job in the past year; more than one in six respondents (17.1%) reported unfairly not being hired for a job for which they were qualified in the past year; 5.5% reported being unfairly denied a job promotion in the past year; 1.8% reported being unfairly prevented from moving into or buying a house or apartment in the past year; 3.3% reported being unfairly denied a loan in the past year; and 4.5% reported being unfairly stopped, searched, questioned, physically threatened, or abused by the police in the past year.
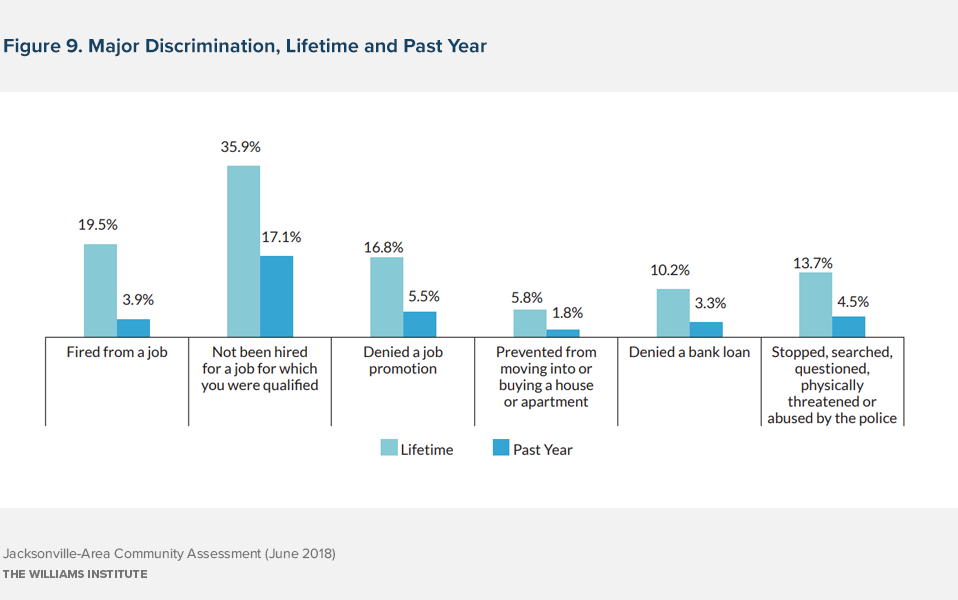
  • African American respondents were more likely to report having been unfairly treated in being fired from a job (10.7%), denied a job promotion (8.8%), denied a bank loan (11.5%), and being stopped, searched, questioned, physically threatened, or abused by the police (10.1%) in the past year than white respondents.
  • Gender minority respondents were more likely to report having been unfairly treated in being fired from a job (8.3%), not being hired for a job for which they were qualified (34.9%), and being denied a job promotion (15.7%) in the past year than cisgender respondents.
  • Older respondents were less likely than respondents ages 18-54 to have reported being unfairly fired, not hired for a job for which they were qualified (9.9%), denied a job promotion, prevented from moving into or buying a house or apartment (0.0%), denied a bank loan (0.0%), and stopped, searched, questioned, physically threatened, or abused by the police in the past year.
  • Respondents identified many different reasons why they believe they were treated unfairly. The most frequently cited reason for these experiences was the respondent’s sexual orientation.
  • African American respondents, gender minority respondents, and respondents assigned female at birth in the sample attributed employment discrimination experiences to many causes; however, they were also more likely to report employment discrimination due to race, gender expression or transgender status, or sex, respectively, than other respondents.
  • Among those who reported experiences of discrimination, few sought legal recourse.

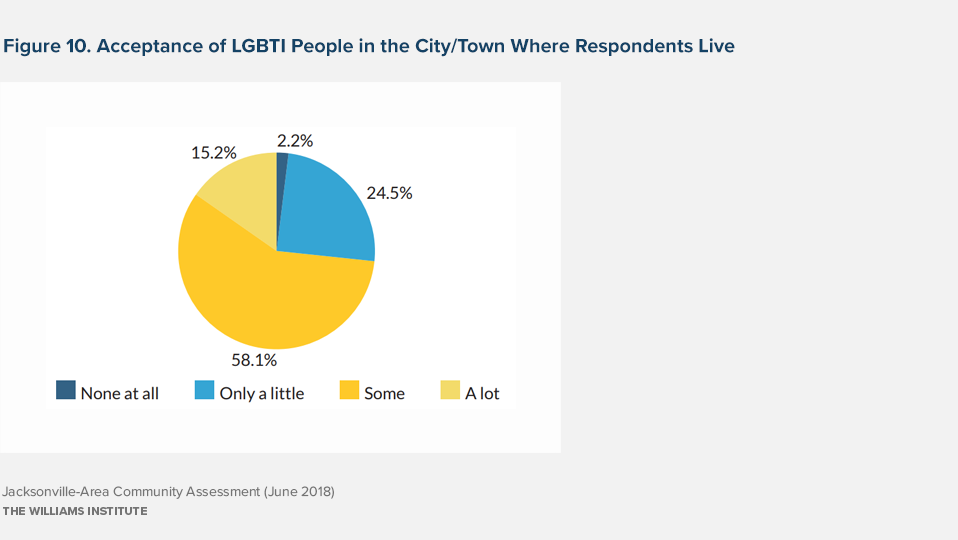
Perceptions of Jacksonville and Northeast Florida

  • As shown in Figure 10, a majority (73.3%) of respondents indicated that they felt there was at least some acceptance of LGBTI people in the city or town where they lived, including 58.1% who reported that there was some acceptance and 15.2% who indicated that there was a lot of acceptance; however, just over a quarter (26.7%) of the sample reported that there was only a little (24.5%) or no acceptance (2.2%) in these places.
  • Over a quarter (28.6%) of respondents agreed that Jacksonville is a city that embraces diversity, yet nearly half (49.7%) disagreed.
  • Just 17.0% of respondents agreed that Northeast Florida is an area that embraces diversity; a larger proportion (57.7%) disagreed.
  • Roughly half of the sample (48.8%—53.6%) disagreed that the laws in Jacksonville and Northeast Florida, respectfully, adequately protect LGBTI persons and families.
  • As shown in Figure 11, the majority of respondents felt connected to and endorsed positive views of the local LGBTI community. Yet, more than a third (33.4%) of respondents indicated that they did not feel they were a part of the LGBTI community and (37.8%) did not feel a bond with the LGBTI community.
  • The majority of African American respondents reported a strong relationship and positive views of the LGBTI community; however, somewhat smaller proportions of African American than white respondents endorsed positive feelings of connectedness to the LGBTI community


Recommendations

  • Foster a social environment that embraces LGBTI residents of Northeast Florida and creates a welcoming environment across service systems. Increase the presence of liaisons to the LGBTI community within the city government, the police department, the health department, and other city agencies to facilitate service-seeking, appropriate outreach and intervention, and service utilization by LGBTI residents.
  • Reduce discrimination experienced along many axes of inequality (sexual orientation, race, sex, and gender expression) and increase access to legal services for those who experience discrimination.
  • Reduce food insecurity by ensuring that food security programs, poverty reduction programs, and jobs that pay livable wages are accessible to LGBTI adults, particularly gender minorities.
  • Ensure that health promotion efforts, including prevention and intervention, incorporate LGBTI people starting in adolescence. This includes smoking prevention and cessation, as well as intimate partner violence prevention and support services.
  • Ensure access to LGBTI-competent health care, particularly behavioral health services, to address depression and substance misuse. This includes access to in-patient services that provide room assignments by gender identity rather than assigned sex at birth.
  • Increase outreach by LGBTI-affirming/accepting places of worship to the larger LGBTI community of Northeast Florida, given the importance of religion to many in the community and relatively low levels of religious attendance.
  • Ensure that LGBTI people have access to competent reproductive technology services to create families (and to bank gametes before initiating hormone therapy) and work to reduce barriers to cost.
  • Build upon high levels of pride and connectedness in the larger LGBTI community to increase trust and cohesion, specifically, by addressing racism and other issues of importance to LGBTI African American residents.

Download the full report

Jacksonville-Area Community Assessment