Executive Summary
Over 11.3 million LGBT adults live in the U.S. They are a part of every community throughout the country and are diverse in terms of personal characteristics, socioeconomic outcomes, health status, and lived experiences. In many ways, LGBT people are similar to their non-LGBT counterparts, but also show differences that illuminate their unique needs and experiences related to sexual orientation and gender identity.
About 40% of LGBT adults are people of color, including 12% who identify as Black. In this report, we analyzed data from several sources to provide information about adults who self-identify as Black and LGBT. We present an overview of their demographic characteristics and focus on several key domains of well-being, including mental health, physical health, economic health, and social and cultural experiences. In addition, we compared Black LGBT and non-LGBT adults across these indicators in order to explore differences related to sexual orientation and gender identity among Black Americans. For several key indicators, we also compared Black LGBT and non-LGBT women and Black LGBT and non-LGBT men in order to explore differences related to gender.
This report is part of a larger series, LGBT Well-Being at the Intersection of Race, which provides the same information for each racial/ethnic minority group in the U.S. A final comparative report examines differences across racial groups among LGBT people.
Key Findings
Demographic characteristics
- An estimated 1,210,000 U.S. adults self-identify as Black and LGBT.
- Regional distribution patterns of Black LGBT and non-LGBT Black adults are similar, except Black LGBT people are slightly less likely to live in the South and more likely to live in the West. About half (51.4%) of Black LGBT adults live in the U.S. South. Nearly one-fifth (19.8%) live in the Northeast, 18% live in the Midwest, and 10.8% live in the West.
- The Black LGBT adult population is younger than the population of Black non-LGBT adults. Over half (57%) of Black LGBT adults are under age 35 compared to 34% of Black non-LGBT adults.
- The gender divide among Black adults is greater for Black LGBT adults as 61% of Black LGBT adults are women compared to 56% of Black non-LGBT adults who are women.
- Educational attainment for Black LGBT and non-LGBT men is similar, but Black LGBT women (24%) are less likely to have a college degree than Black non-LGBT women (30%).
- Among those who are married or cohabitating, about 60% of Black LGBT men and women have a different-sex partner.
- Over one-third (36%) of Black LGBT adults are raising children. Black LGBT women (44%) are raising children at the same rate as Black non-LGBT women (45%).
Economic characteristics
- Black LGBT adults are more likely to experience economic insecurity than Black non-LGBT adults.
- Nearly 40% of Black LGBT adults have a household income below $24,000 per year compared to 33% of Black non-LGBT adults.
- Black LGBT adults are more likely to be unemployed (14% compared to 10%) and to experience food insecurity (37% compared to 27%) than Black non-LGBT adults. The disparity in food insecurity is much more pronounced for Black LGBT and non-LGBT women (41% vs. 29%) than for Black LGBT and non-LGBT men (31% vs. 25%).
- Over half (56%) of Black LGBT adults live in low-income households (below 200% of the federal poverty level) compared to 49% of Black non-LGBT adults. Black LGBT (61%) and non-LGBT (53%) women were more likely to live in low-income households compared to Black LGBT (48%) and non-LGBT (44%) men.
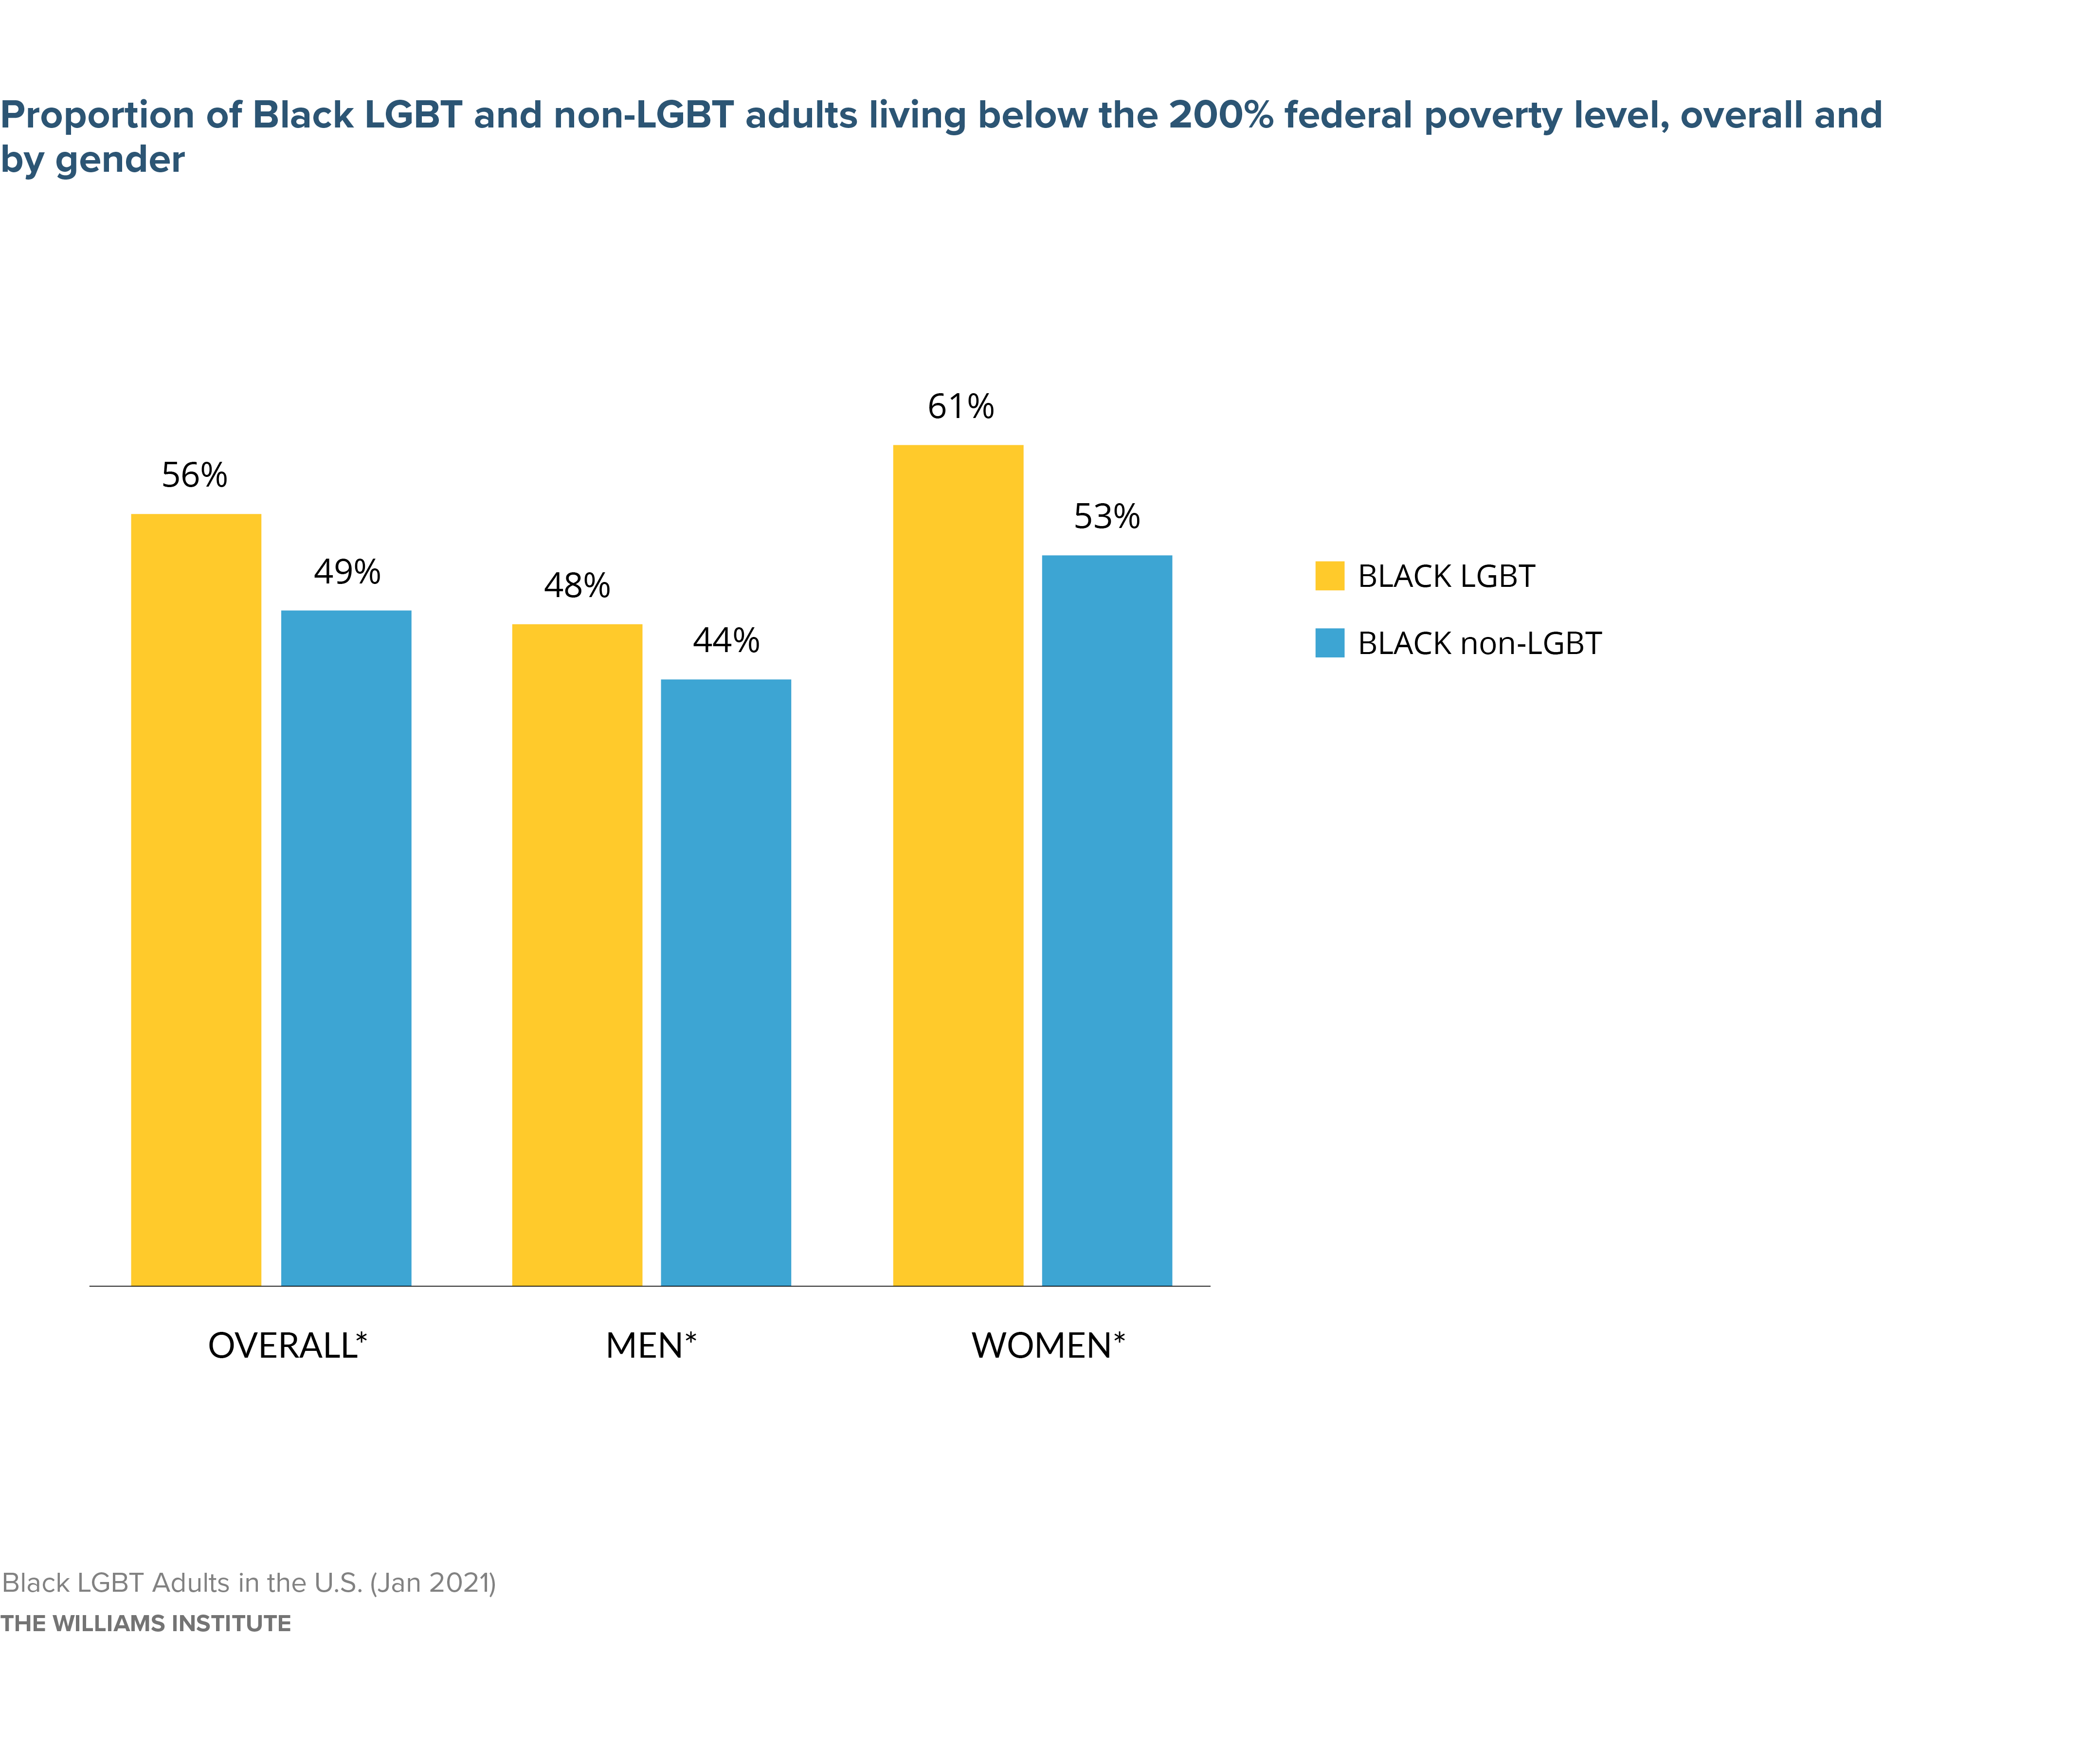
Source: Gallup 2012-2017 data
Note: * indicates that the estimates between LGBT and non-LGBT adults are statistically different
Mental and physical health
- Black LGBT adults (24%) were slightly more likely to report that their overall health is fair or poor than Black non-LGBT adults (22%).
- Over one-quarter (26%) of Black LGBT adults have been diagnosed with depression compared to 15% of Black non-LGBT adults. Black LGBT (29%) and non-LGBT (17%) women were more likely to be diagnosed with depression than Black LGBT (21%) and non-LGBT (12%) men.
- Black LGBT adults are more likely to engage in high-risk health behaviors than Black non-LGBT adults. Among Black LGBT adults, 34% report current smoking and 5% report heavy drinking compared to 23% and 2% of non-LGBT adults, respectively.
- Black LGBT adults are more likely to have a mild disability (25%), defined as experiencing limitations because of poor health for 1-14 days in the past month than Black non-LGBT adults (20%), though the same percentage (10%) of both groups experience high disability, defined as experiencing limitations because of poor health for 15-30 days in the past month.
- Black LGBT adults had greater odds of being diagnosed with several serious health conditions including asthma, heart attack, and cancer compared to Black non-LGBT adults
- Among Black LGBT adults, 56% are tested for HIV at least once a year while 24% had never been tested for HIV.
Access to health care
- Black LGBT women are more likely to lack health insurance than Black non-LGBT women: 20% of Black LGBT women are uninsured compared to 12% of Black non-LGBT women, whereas approximately 18% of both Black LGBT and non-LGBT men are uninsured.
- More Black LGBT adults (17%) have Medicaid as their primary insurance than non-LGBT adults (13%). Among Black men, more LGBT (14%) than non-LGBT (10%) men receive Medicaid. Among Black women, more LGBT (19%) than non-LGBT (17%) women receive Medicaid.
- Seventy percent of Black LGBT adults have a personal doctor compared to 77% of Black non- LGBT adults.
Discrimination and stressful events
- More than half (55%) of Black LGBT adults said the city or area in which they live is not a good place for transgender people and 39% said it is not a good place for LGB people. More than a third of Black LGBT adults also said it is not a good place for racial/ethnic minorities (36%) and immigrants from other countries (40%).
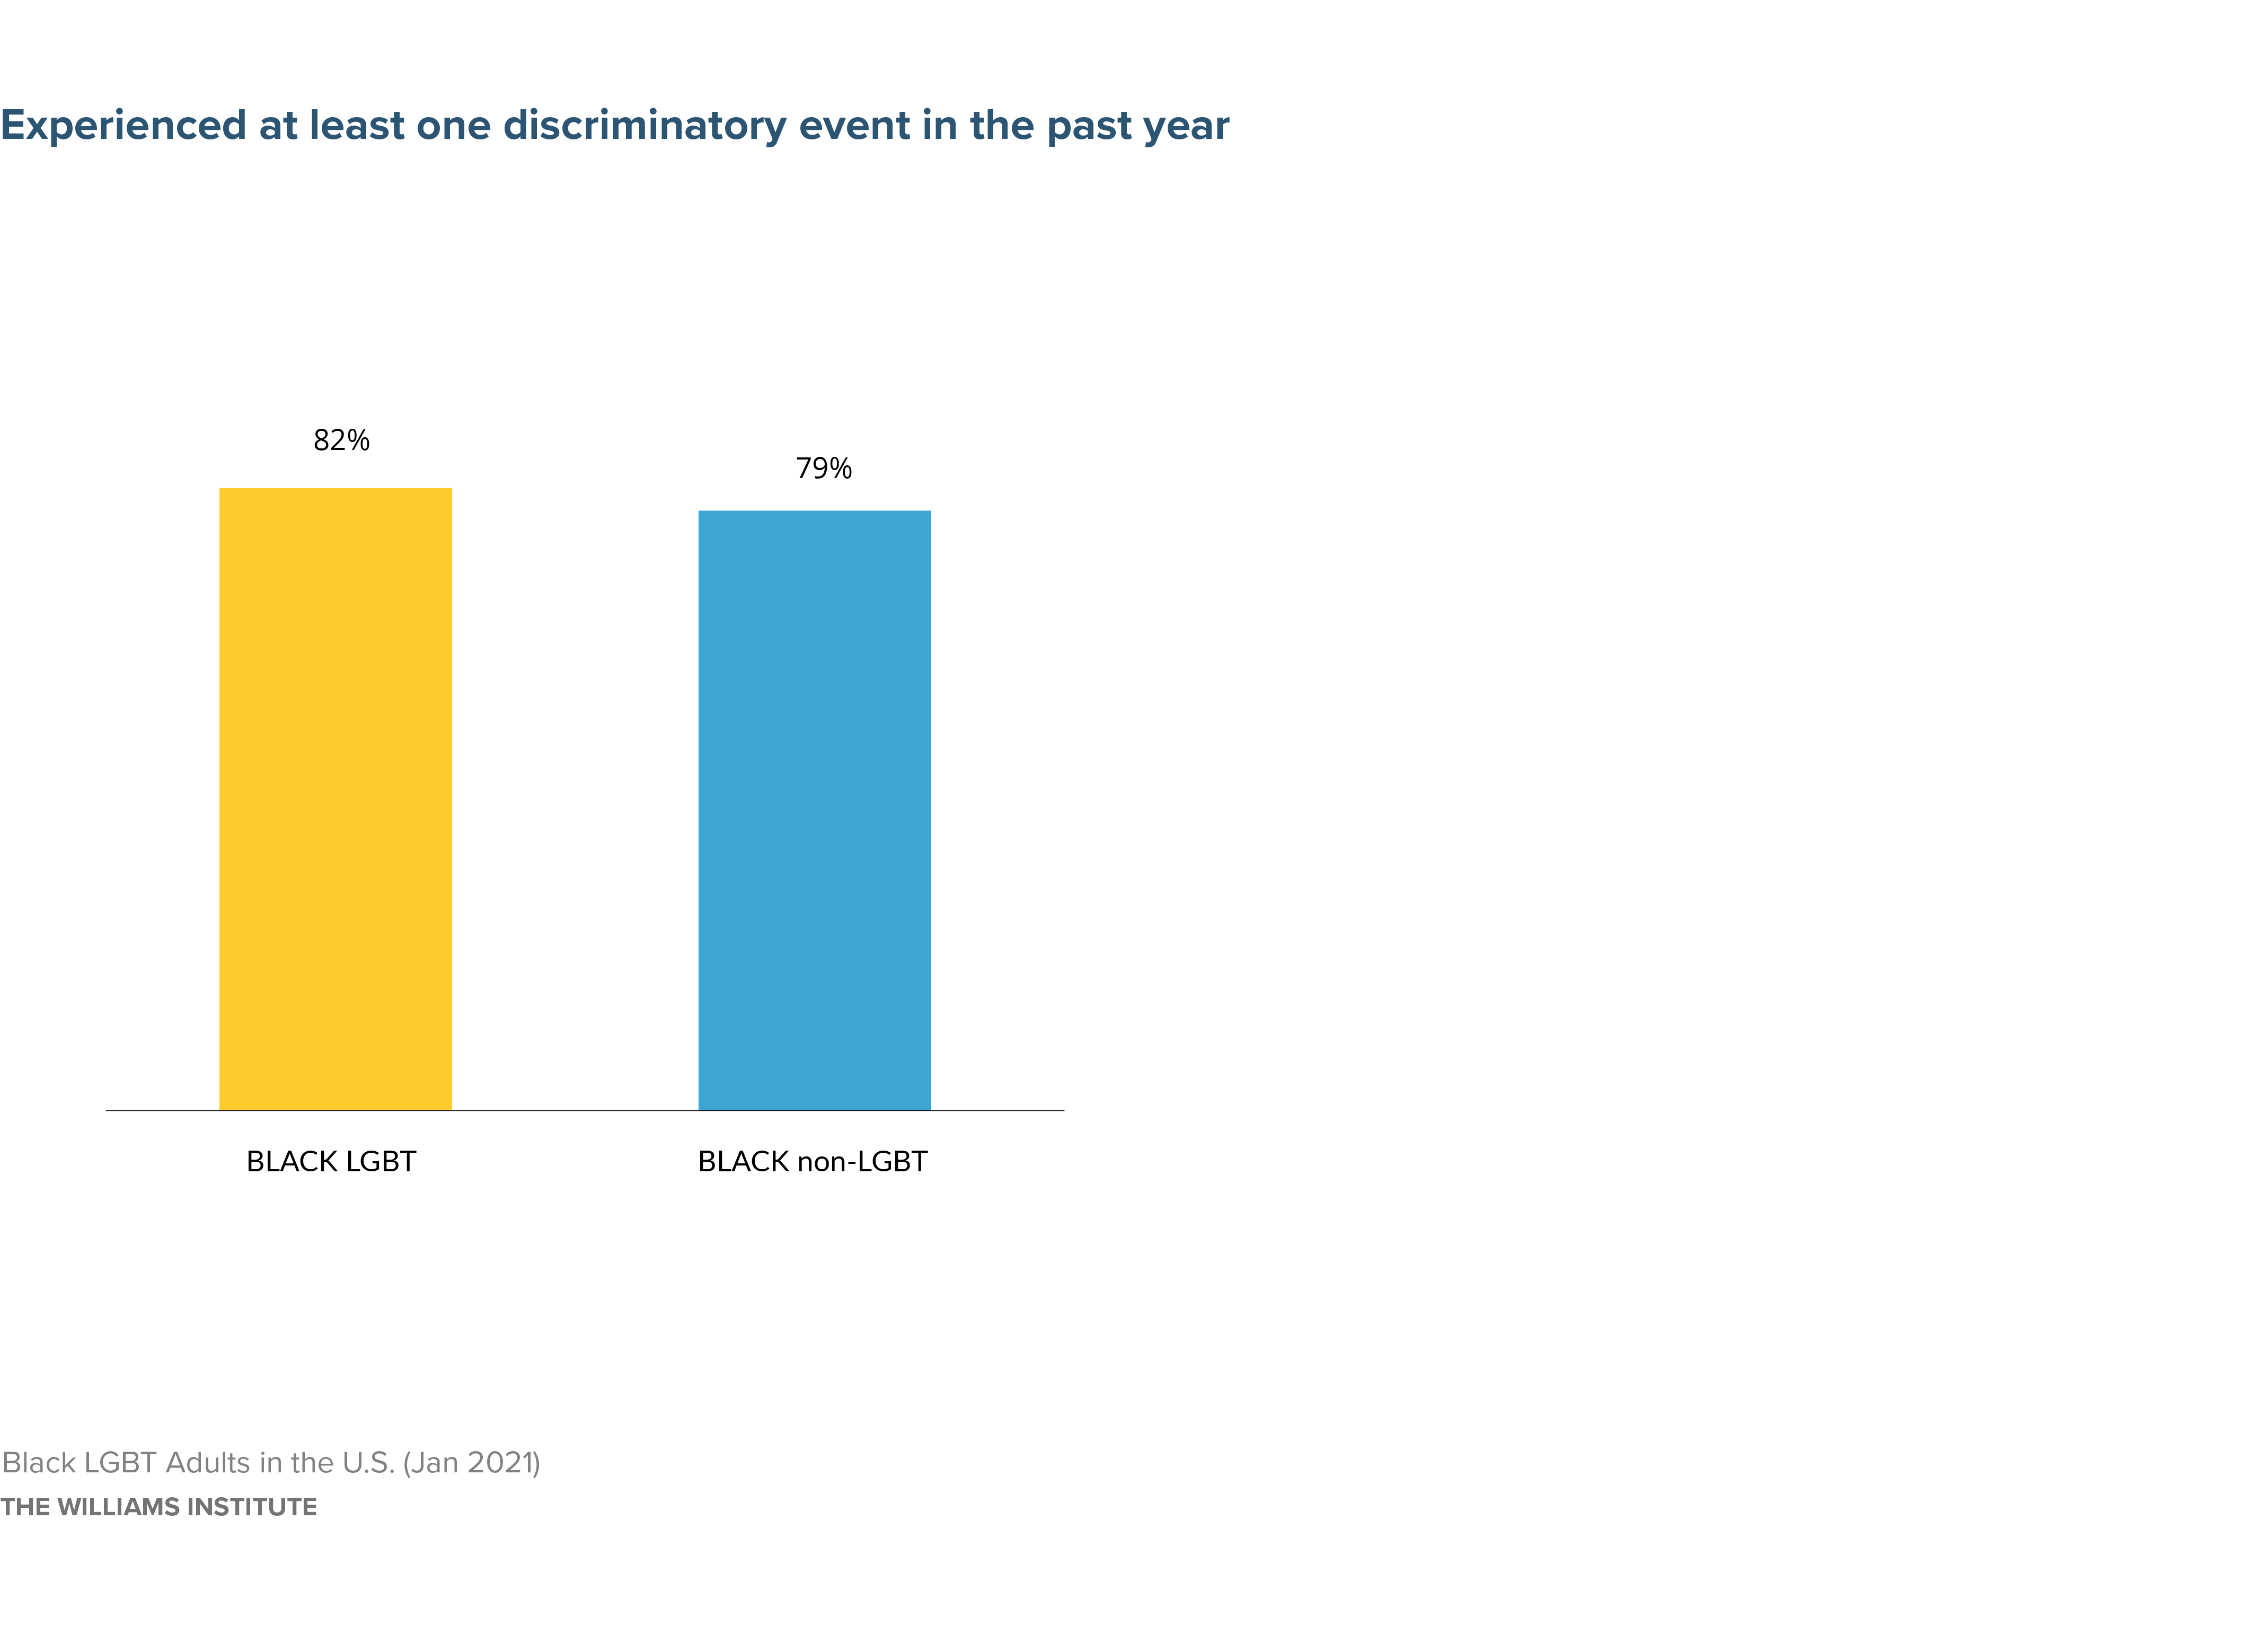
- Both Black LGBT and non-LGBT adults reported experiences with everyday discrimination. A slightly higher percentage of Black LGBT adults (82%) reported experiences of everyday discrimination than Black non-LGBT adults (79%), but the majority of both groups of Black adults in the U.S. indicated that discrimination is an issue.
- A large proportion of Black LGBT adults have experienced victimization, including 79% who reported verbal insults or abuse, 60% who reported being threatened with violence, 44% who were physically or sexually assaulted, and 43% who experienced robbery or property destruction.
- Nearly half (49%) of Black LGBT adults reported being fired from or denied a job and 30% reported receiving a negative review or being denied a promotion at work. Black non-LGBT adults reported these experiences at similar rates.
- Many Black LGBT adults have experienced financial stress. For example, 71% said they did not have enough money to make ends meet, 43% experienced a major financial crisis within the past year, from when the survey was administered in 2016-2017, and 26% were fired or laid off from a job in that same past year. and 26% were fired or laid off from a job within the past year.
Minority stress and support
- Most Black LGBT adults (71%) reported they were “out” to healthcare workers. However, overall, Black LGB and transgender adults reported concealing their sexual orientation or gender identity and experiencing internalized homophobia or transphobia to some degree. Black transgender adults rated higher on having these experiences than Black LGB adults, though the difference was not statistically significant.
- Overall, Black LGBT adults reported being somewhat worried that their sexual orientation or gender identity will affect the quality of health care they received.
- Large percentages of Black LGBT adults also reported family and relationship stress. For example, 49% said their relationship with their parents is strained; 40% said they have a close relative or partner in very bad health; and 19% said they separated, divorced, or broke off a significant relationship within the past year from when the survey was administered in 2016- 2017.
- About 62% of Black cisgender LGB adults and 29% of Black transgender adults reported feeling connected to the LGBT or their gender minority community.
- Black LGBT and non-LGBT adults had a similar sense of belonging to Black communities and were similar in terms of how much general social support they thought they received. Nearly half of Black
- LGBT (48%) and non-LGBT (46%) adults reported feeling connected to Black communities and about 55% of Black LGBT adults and 65% of Black non-LGBT adults reported feeling social support.
In addition to presenting national data, we compared Black LGBT and non-LGBT adults on several key outcomes by region in the U.S.: South, Northeast, Midwest, and West. Overall, patterns identified within each region reflect what we found across the U.S. Full details on the regional analyses can be found on page 32 of the report.
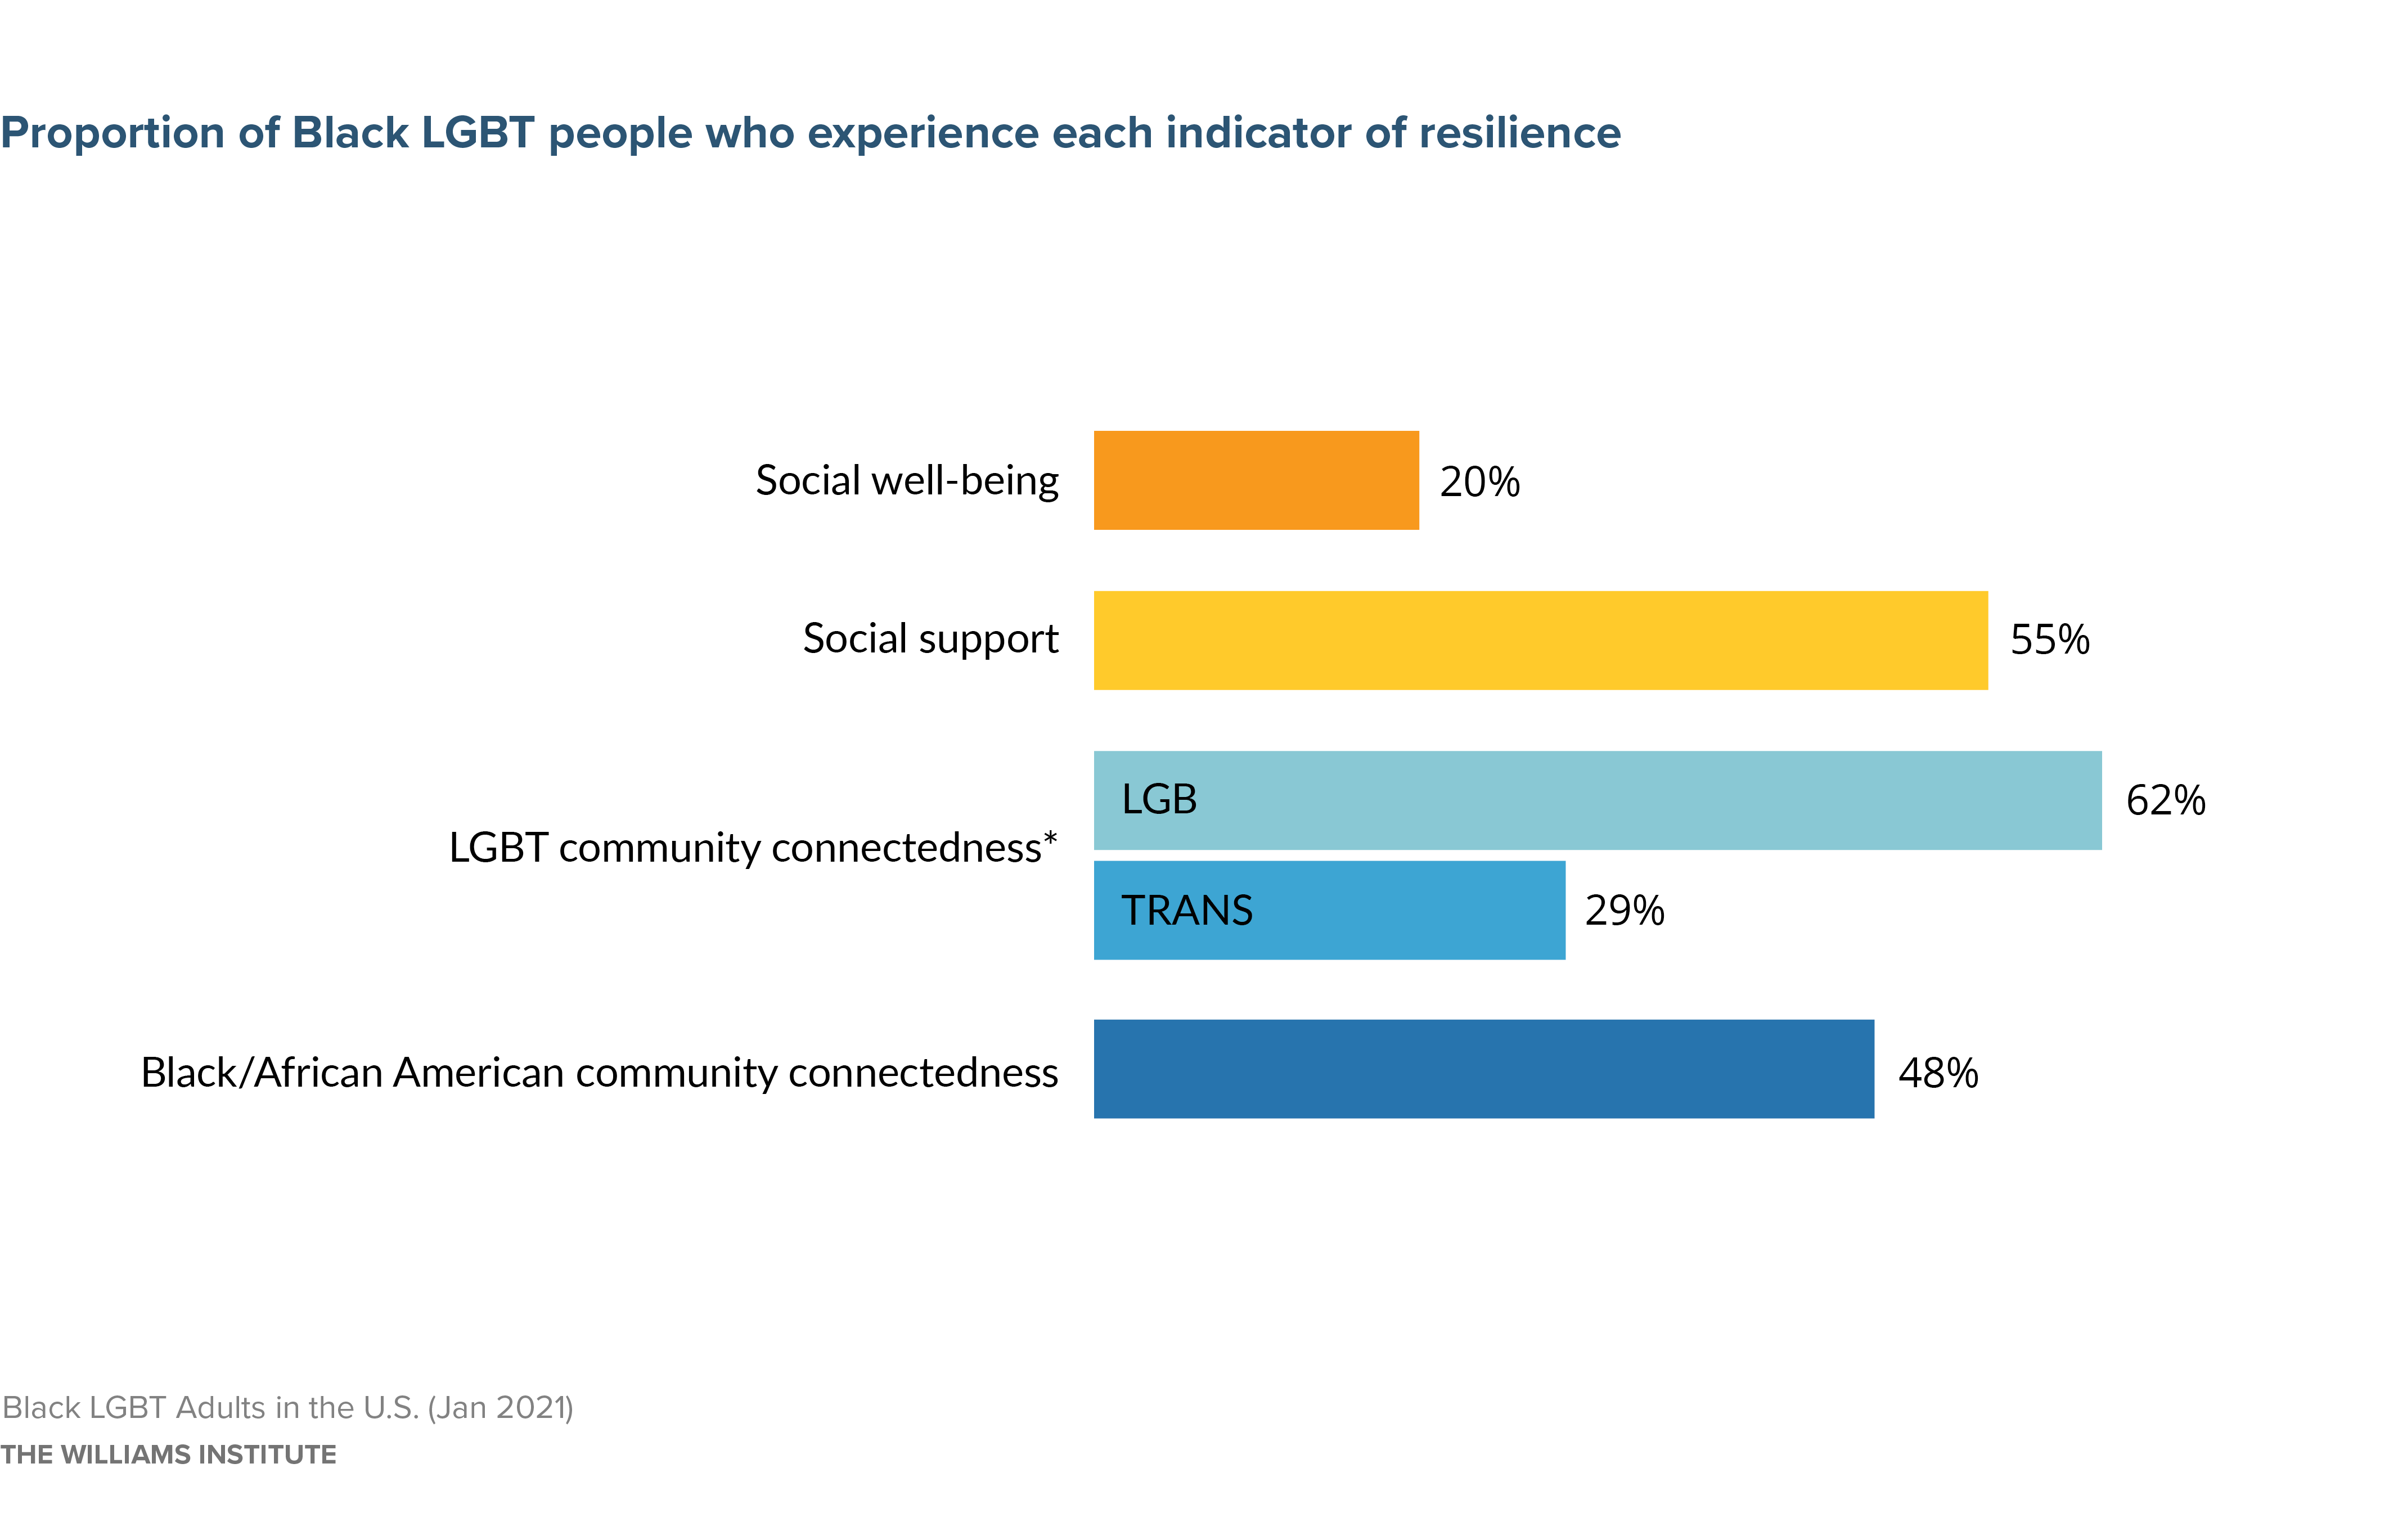
Note: Findings indicate percentage that endorse each indicator at a moderate level.
*Participants to the Generations survey responded to questions about their connection to the LGBT community.
Participants in the TransPop survey responded to questions about their connection to the transgender community.
Across measures of well-being, there are both similarities and differences among Black adults when we compare the population by LGBT status. In almost all areas of economic and social vulnerability, such as employment, income, food insecurity, and healthcare access, Black LGBT adults fared worse than their non-LGBT counterparts. Disparities were also observed in several areas of mental and physical health, particularly depression and asthma, as well as vulnerability to mild degrees of disability. There were a few notable similarities, such as likelihood of being a parent (among women) and similar vulnerability to stigma and healthcare access issues. Black LGBT and non-LGBT people were also similar in terms of social well-being and other indicators of resilience. In particular, centrality of racial identity and sources of social support were similar for Black LGBT and non-LGBT adults.
The findings illuminate areas where the Black LGBT subpopulation may be more in need of or impacted by policy and services interventions, particularly related to improving conditions for economic stability, safety from violence, and mental health. Future research should examine in more detail the factors that are driving the poor outcomes for Black people overall, as well as the differences between Black LGBT and non-LGBT adults in the U.S.
Download the full report