Overview
This report uses the best available data to provide a population estimate of LGBT African-Americans and African-American same-sex (SS) couples in the United States, along with a general overview of their socioeconomic and demographic characteristics.
Geographic Distribution
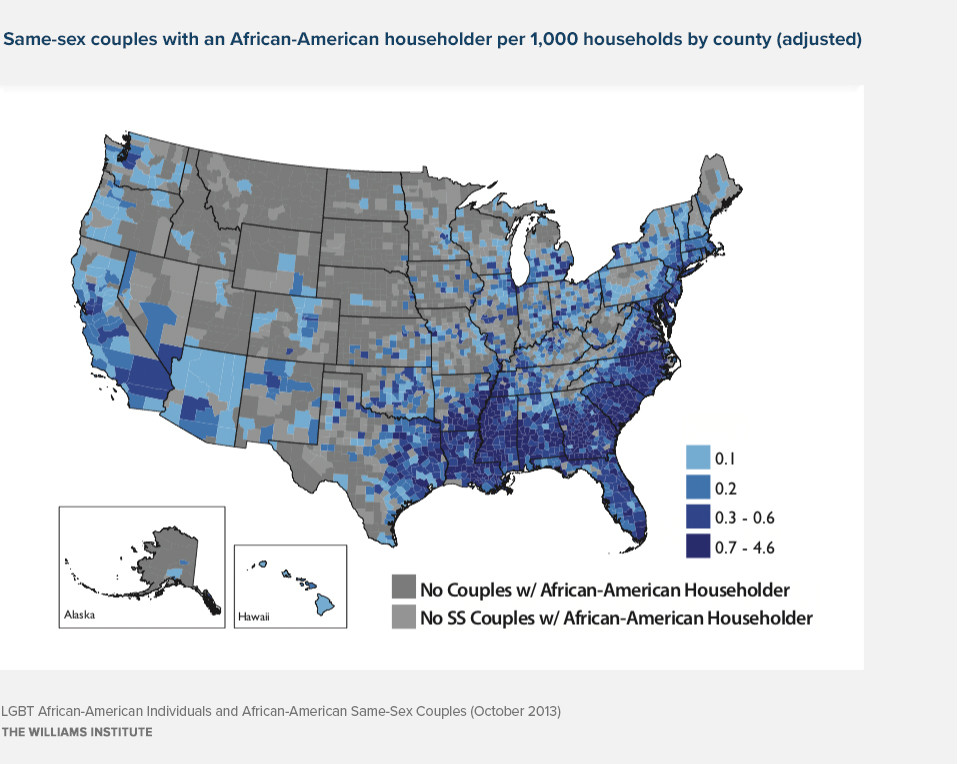
African-American individuals in same-sex couples tend to live in areas where there are higher proportions of African-Americans, as opposed to areas with higher proportions of the broader LGB population. More than 1/4 of African-American same-sex couples live in Georgia, New York, Maryland, and North Carolina.
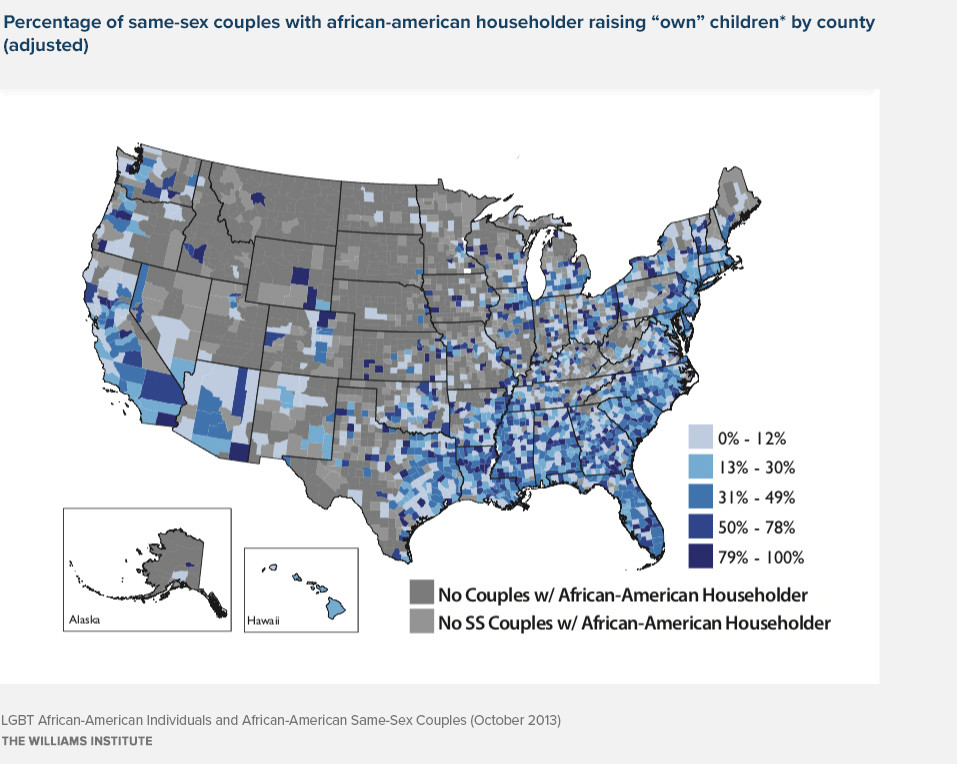
The county-level maps use U.S. Census 2010 data measuring same-sex couples. The Census data describe both different-sex (DS) and same-sex (SS) couples by the race or ethnicity of the “householder,” who was Person 1 on the Census form. Person 1 is usually the person in whose name the home is either owned or rented. Appendix A contains a detailed description of who is included in each section of this snapshot report, along with additional information on how to understand the map key.
Source: U.S. Census 2010 data (adjusted)
Key Findings
- Overall, how African-American same-sex couples fare compared to their different-sex counterparts varies significantly depending on the gender of the couple and whether the couple is raising children.
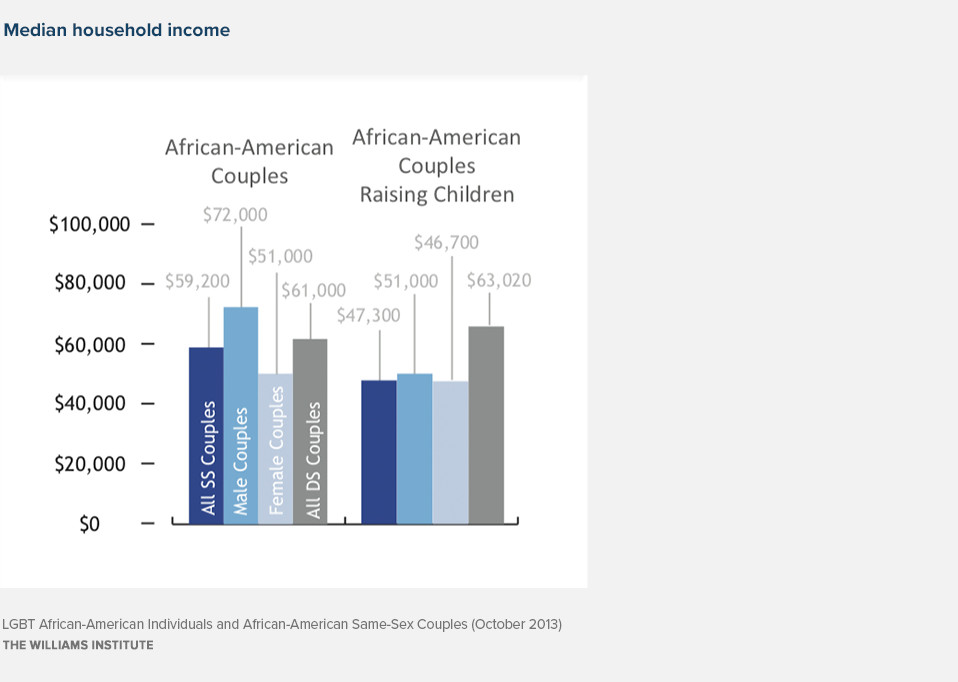
- 34% of African-American same-sex couples are raising children. African-American same-sex couples raising children report household median incomes $15,000 lower than comparable African-American different-sex couples ($47,300 vs. $63,020).
- African-American female same-sex couples report household median incomes $20,000 less than African-American male same-sex couples ($51,000 vs. $72,000).
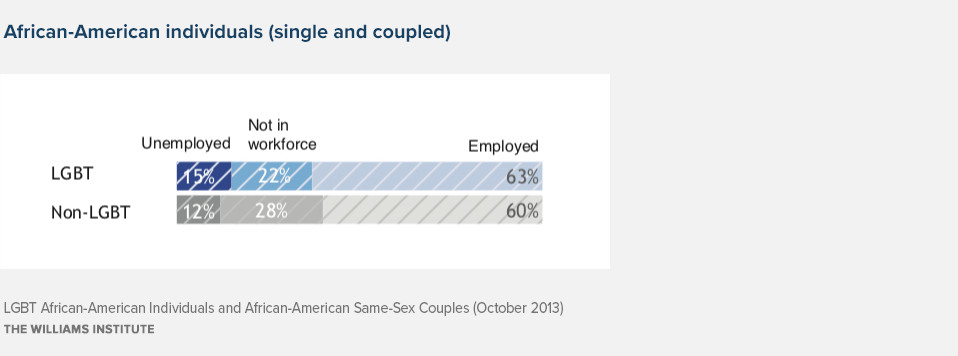
- LGBT African-Americans have higher rates of unemployment compared to non-LGBT African-Americans (15% vs. 12%).
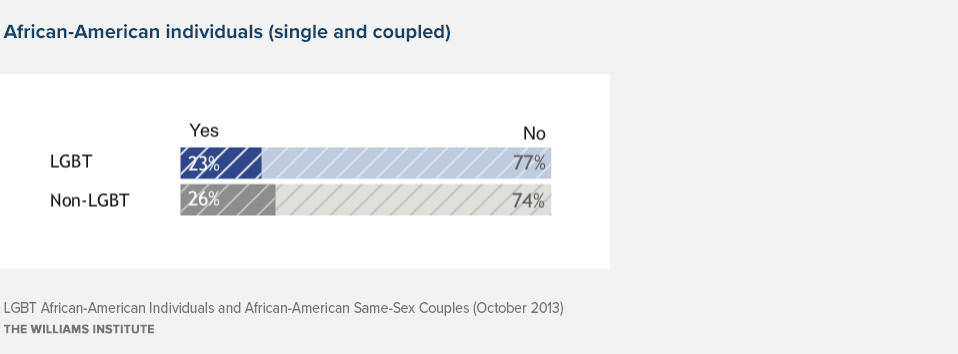
- 23% of LGBT African-Americans have completed a college degree or more, compared to 26% of non-LGBT African-Americans.
- African-American same-sex couples are less likely than their different-sex counterparts to have health insurance coverage for both partners (63% vs. 79%).
- Notably, 58% of African-American same-sex couples are female.
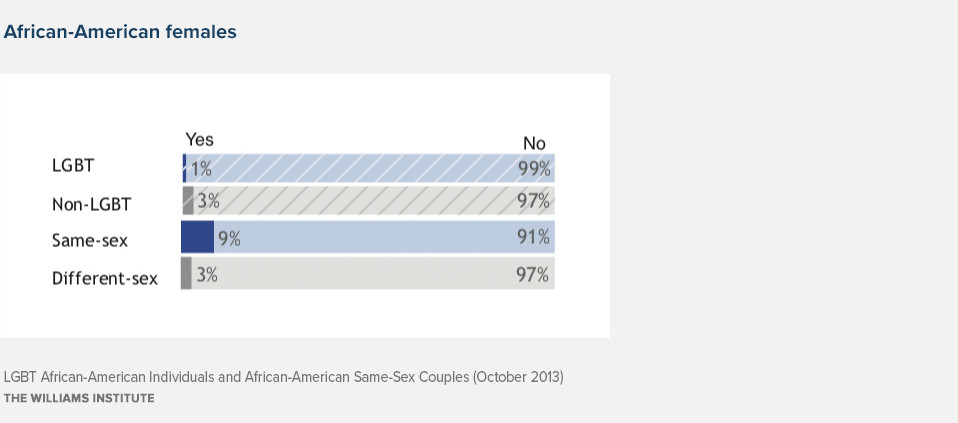
- Female African-American individuals in same-sex couples are three times more likely to report veteran status than those in different-sex couples (9% vs. 3%). About 1 in 7 male African-American individuals in same-sex couples have served in the military compared to 1 in 4 male African-American individuals in different-sex couples (13% vs. 25%).
Source: U.S. Census 2010 data (adjusted)
African-American Households
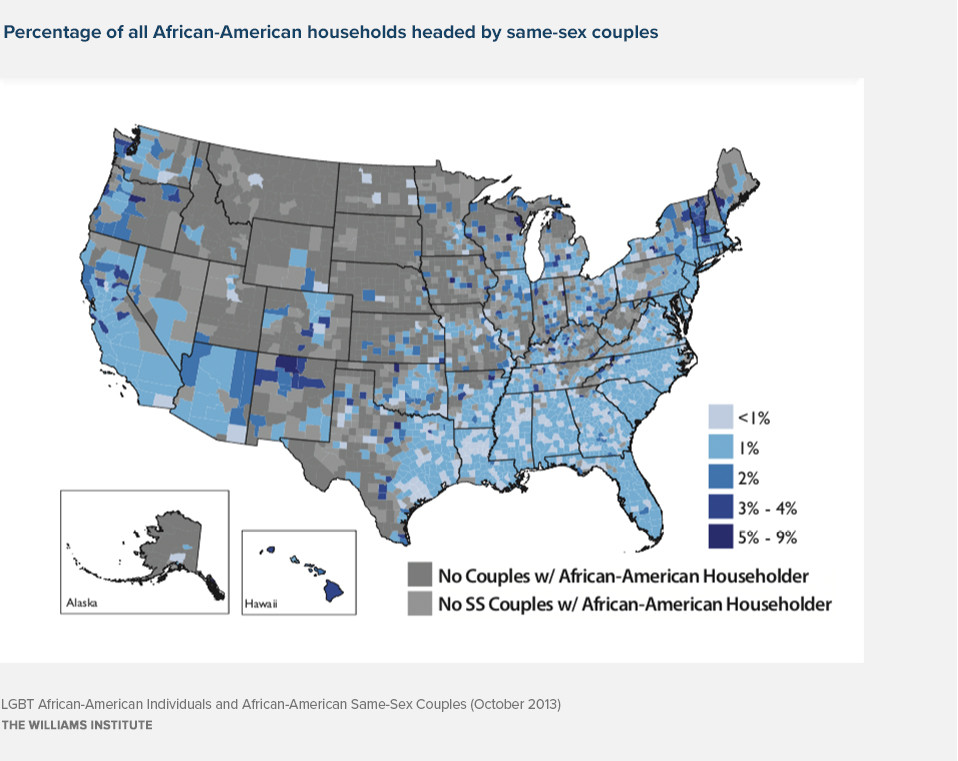
Nationally, 1 in 250 African-American households are led by a same-sex couple (0.4%). Counties where there is a higher proportion of African-American same-sex couples than the national average tend to be in areas where there are fewer African-American households overall, meaning the same-sex households make up a large part of the African-American population in those areas. These counties tend to be in the Northeast, Southwest and Midwest regions of the country.
*“Own” children are never-married children under 18 who are sons or daughters of one partner or spouse (Person 1) by birth, marriage(stepchild), or adoption.
Source: U.S. Census 2010 data (adjusted)
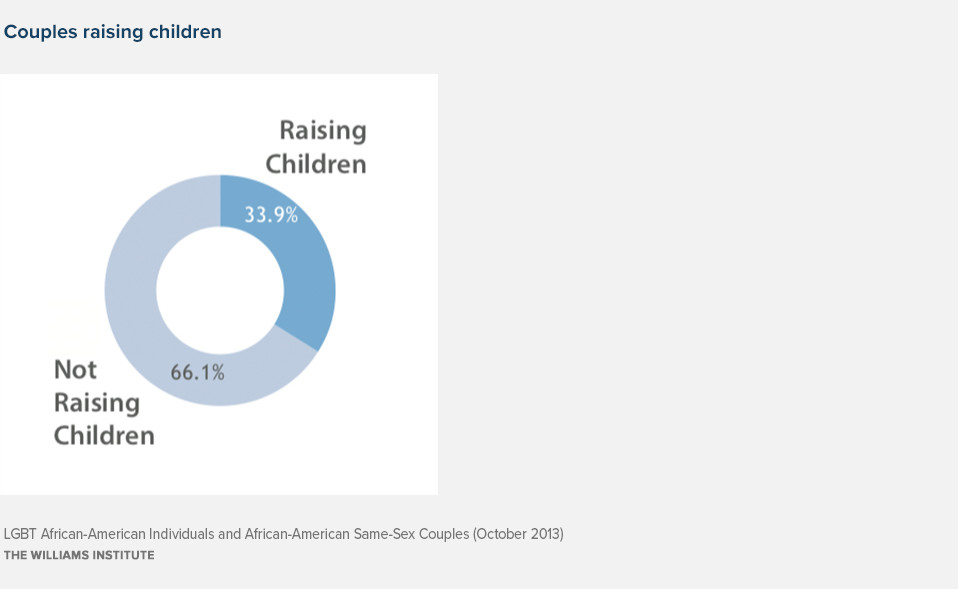
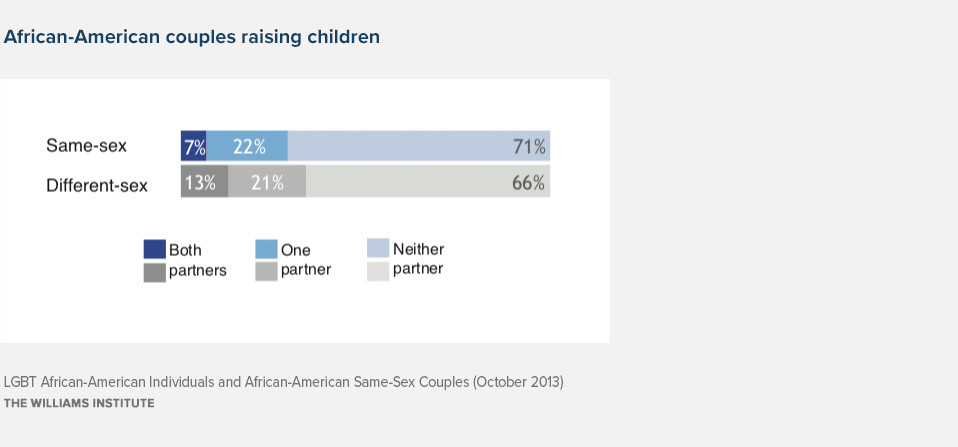
Couples Raising Children
Although 33.9% of same-sex couples with an African-American householder are raising children, these couples are not concentrated in major metropolitan areas. The map on the left indicates that same-sex couples raising children are scattered throughout counties across the nation.
Geography
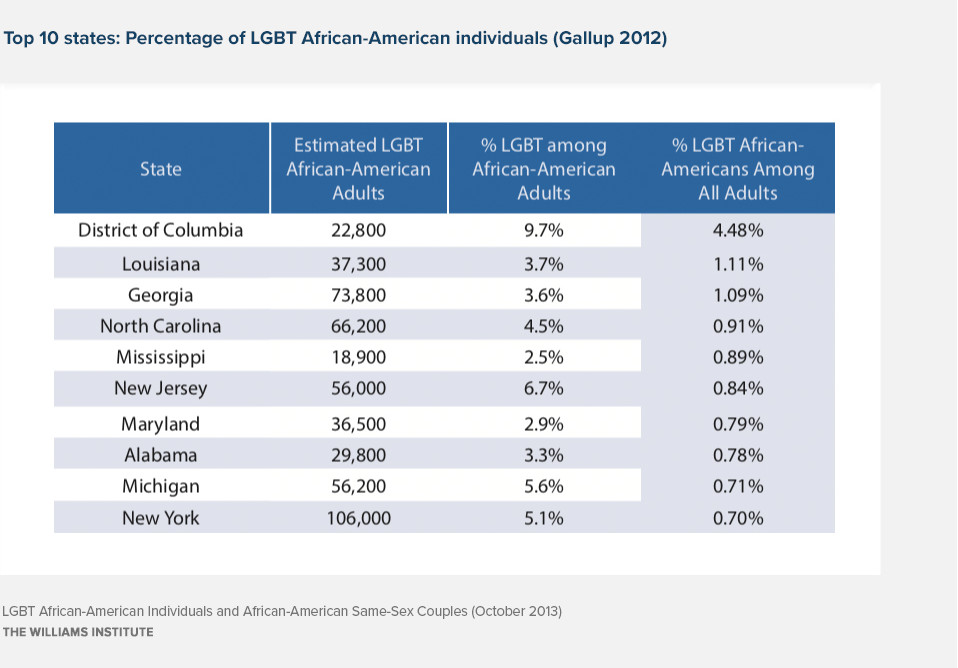
African-Americans in same-sex couples tend to live in areas where there are higher proportions of African-Americans, as opposed to areas with higher proportions of the broader LGB population. This is evident by the inclusion of several Southern states in the top ten list which tend to be areas known for African-American residency, but not LGBT residency. The only exceptions listed are the state of New York and Essex County, New Jersey. In the counties below, the percent of African-American same-sex couples raising children ranges from 6% to 58%.
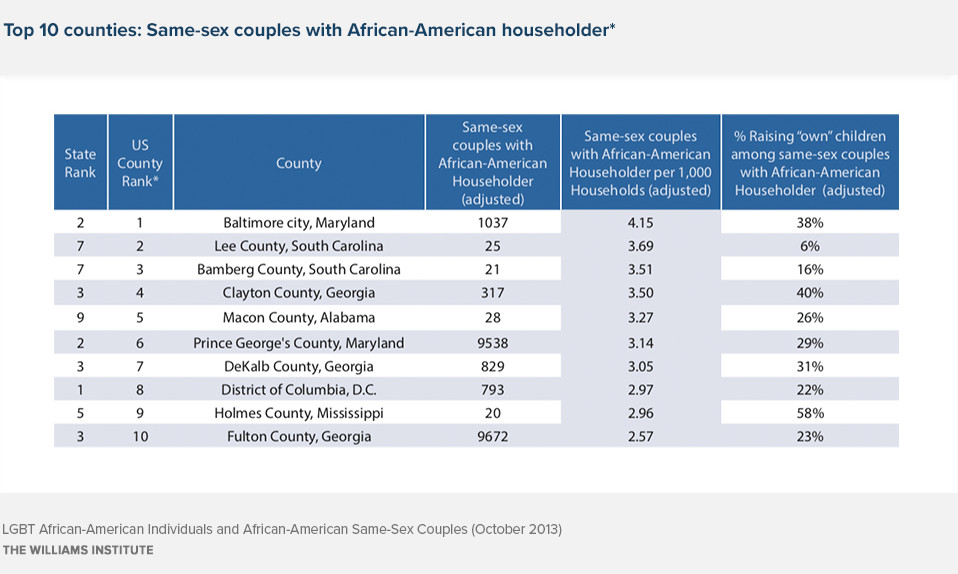
*Including those counties with 20+ same-sex couples with an African-American householder
Characteristics of African-American Individuals
The unit of analysis in this section is the individual. We use Gallup Daily tracking survey data to report on characteristics for those that self-identify as LGBT (both single and coupled). We use ACS data to report on the characteristics of individuals in couples. We highlight several characteristics in the charts below, with the additional information listed in Appendix B.
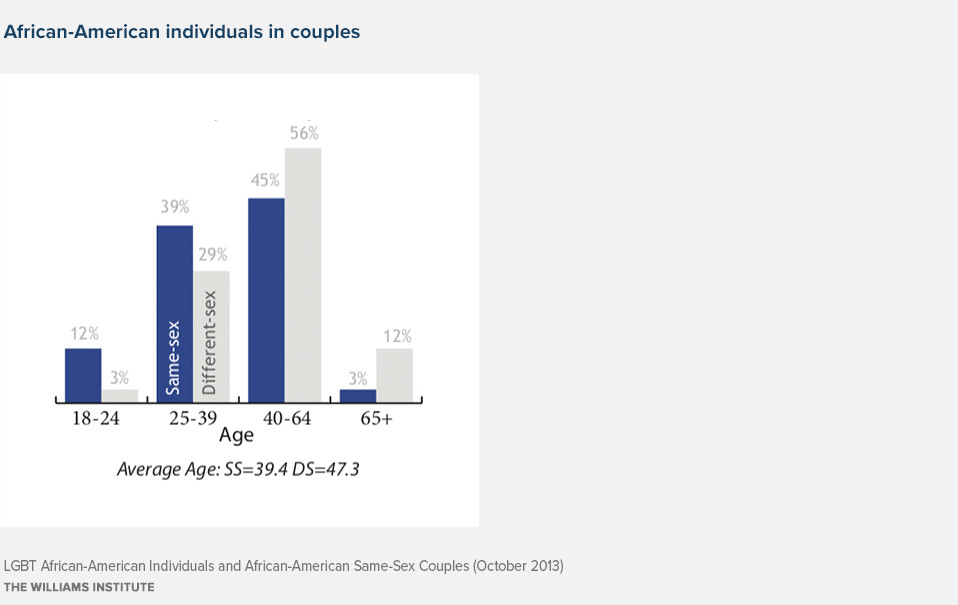
Age Distribution
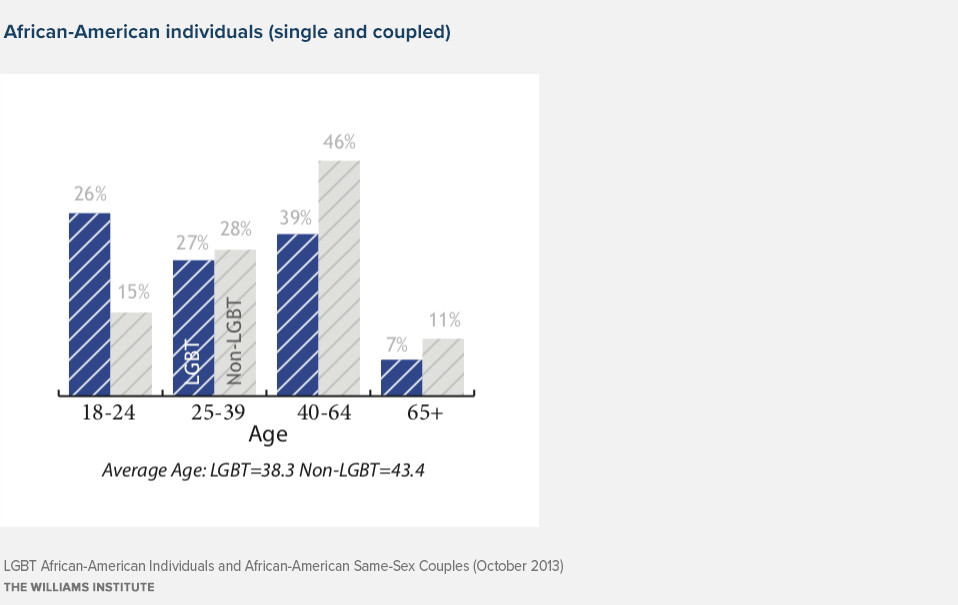
Direct comparisons between individuals in same-sex couples and all LGBT individuals must be made with caution, as the age distribution of LGBT individuals in the Gallup survey differs from that of African-American individuals in same-sex couples identified in the ACS. LGBT African-American individuals are much younger than both the non-LGBT African-American population and African-Americans in same-sex couples. These differences in age could help to explain patterns in other demographic characteristics that can be affected by age like education and employment.
Completed a College Degree or More
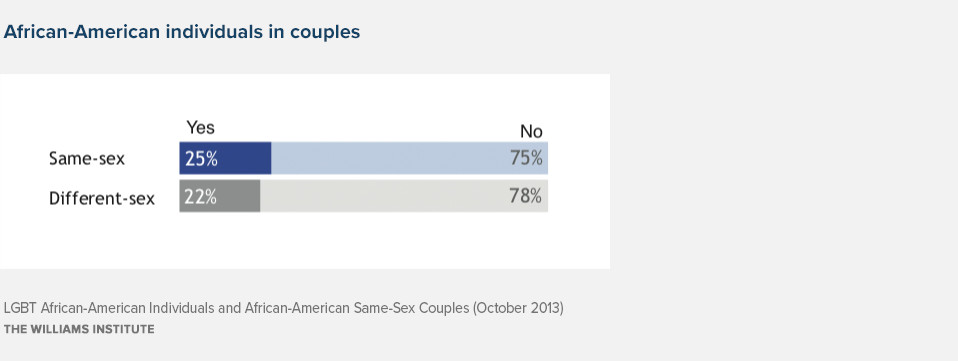
African-American individuals who identify as LGBT in the Gallup survey report lower rates of college completion than non-LGBT adults (23% vs. 26%). African-American individuals in same-sex couples have higher rates of educational attainment than their different-sex counterparts (25% vs. 22%). The different results could be in part because LGBT African-American individuals in the Gallup survey are much younger than their coupled counterparts in the ACS data.
Employment Status
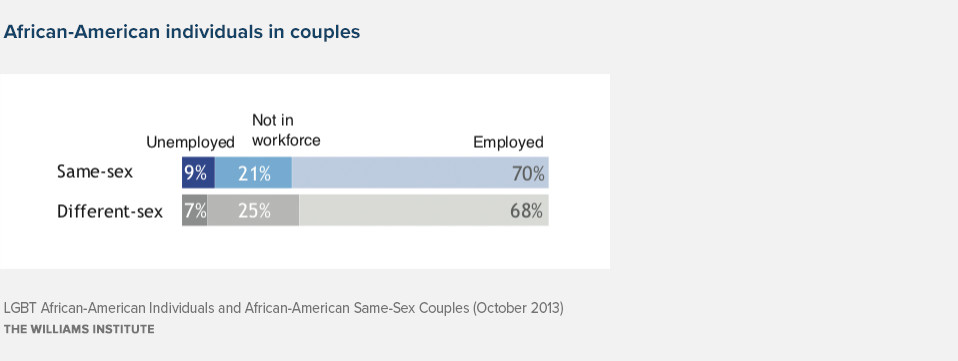
Unemployment rates are higher for African-American individuals who identify as LGBT compared to non-LGBT individuals (15% vs. 12%). African-American LGBT individuals are also more likely to be employed than non-LGBT individuals (63% vs. 60%). The difference lies in the proportion of the respective populations that report as “not in workforce.” The patterns are similar for coupled African-Americans in the ACS data.
Military Status
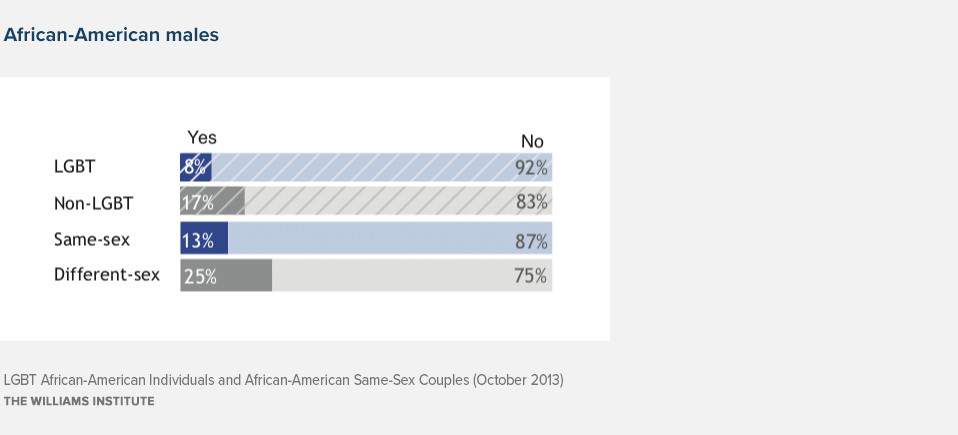
In general, men are much more likely than women to serve in the military. While LGBT African-American men, both individuals and those in same-sex couples, are less likely than comparable non-LGBT African-American men to report military service, they still report relatively high rates of inclusion in the military. 13% of African-American men in same-sex couples report military service. Notably, African-American females in same-sex couples are three times more likely to enter the military than their different-sex counterparts (9% vs. 3%).
Covered by Health Insurance
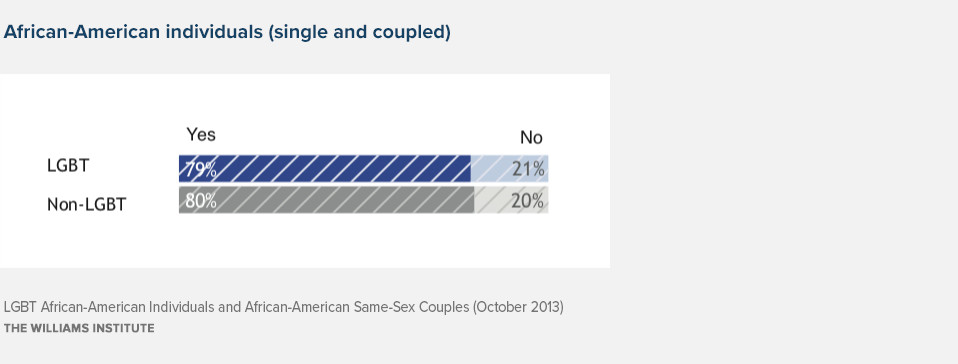
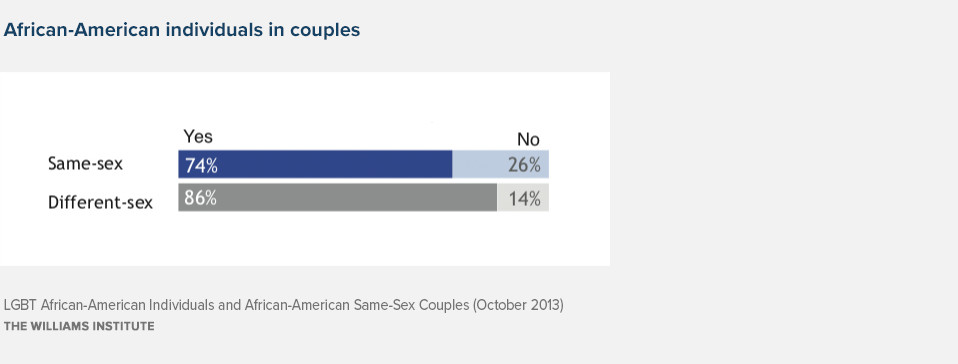
The Gallup survey indicates about 80% of African-American LGBT and non-LGBT individuals are covered by health insurance. The proportion of African-American individuals covered by health insurance is lower for those in same-sex couples than those in different-sex couples (74% vs. 86%).
Median Individual Income
African-American individuals in same-sex couples report lower median income than those in different-sex couples ($25,000 vs. $26,700). When analyzed by gender, females in same-sex couples report incomes slightly higher than those in different-sex couples, while males in same-sex couples report lower incomes than those in different-sex couples. However, males in both groups report higher incomes than females in their respective group. We cannot provide comparable data from the Gallup survey, as they do not include a question regarding individual income.

Partnership Patterns
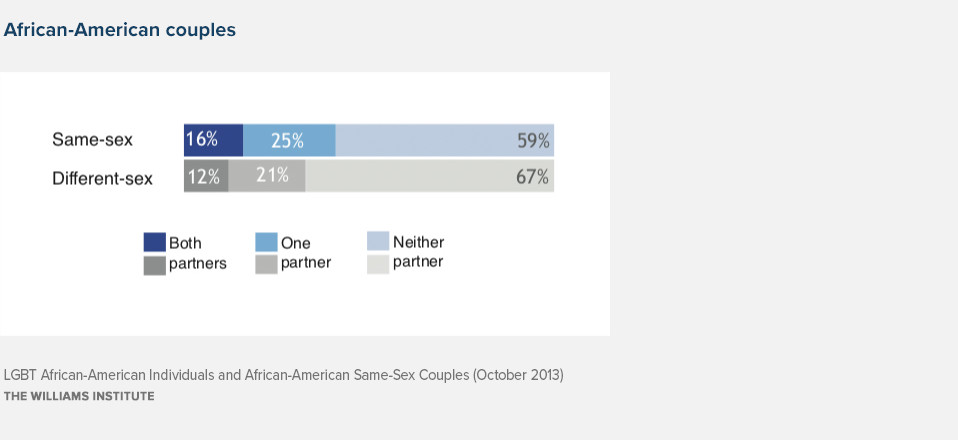
In 47% of same-sex couples with an African-American partner, the other partner is not African-American. This is the case for only 19% of different-sex couples. Same-sex couples with two African-American partners report a lower median household income compared to different-sex couples with two African-American partners ($46,700 vs. $60,000). Notably, both same-sex and different-sex couples with two African-American partners are less likely to have both partners complete a college degree than their counterparts with one African-American partner.

Characteristics of African-American Couples
In this section of the report, the unit of analysis is the couple. Using the couple as the unit of analysis allows us to view the household as a whole. Below, we present information for both same-sex and different-sex African-American couples, indicating whether both, one or neither partner has the attribute in question. We also highlight characteristics of those couples that are raising children.
Completed a College Degree or More
African-American same-sex couples have higher rates of educational attainment by couple than their different-sex counterparts (16% vs. 12%). However, for African-American couples raising children, the percent of same-sex couples that include two college graduates drops to 7%.
Median Household Income
African-American same-sex couples report a lower median household income than different-sex couples ($59,200 vs. $61,000). Notably, African-American female same-sex couples report a median household income about $20,000 less than male same-sex couples ($51,000 vs. $72,000). The gap in reported income by gender for SS couples shrinks when focusing on couples raising children.
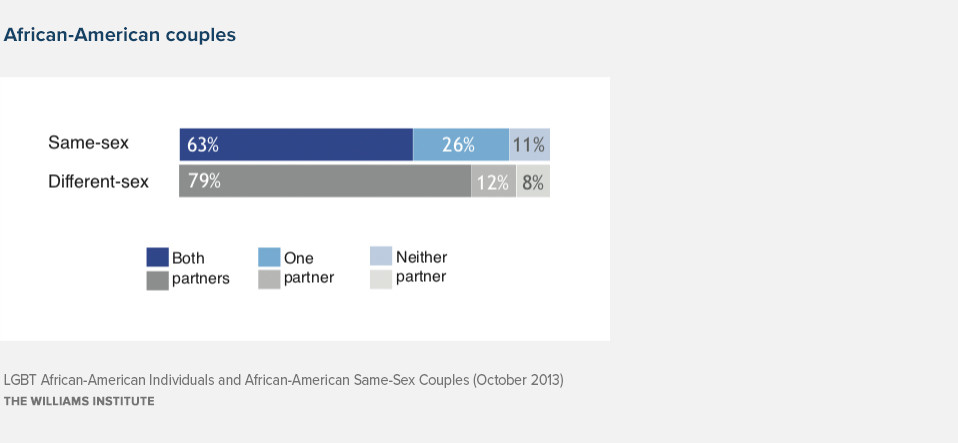
Covered by Health Insurance
Only 63% of African-American same-sex couples have health insurance coverage for both partners. This proportion is much lower than the rates for different-sex couples (79%). The gap between same-sex and different-sex couples becomes even larger in couples raising children (54% vs. 78%).
Conclusion
Overall, how African-American same-sex couples fare compared to their different-sex counterparts varies significantly depending on the gender of the couple and whether the couple is raising children. Female couples and couples raising children are struggling economically, with couples raising children also reporting lower rates of social characteristics that may ultimately affect their families, such as insurance coverage for both partners. While overall higher unemployment rates and lower rates of insurance coverage are cause for concern, there are areas where African-American same-sex couples are faring better than their different-sex counterparts. African-American same-sex couples report higher rates of educational attainment and higher rates of employment.
Download the brief