Overview
This report uses American Community Survey (ACS) data to compare demographic and socioeconomic characteristics of Asian and Pacific Islander (API), Latino and Latina (Latino/a), African-American, American Indian and Alaskan Native (AIAN), and non-Hispanic White (White) individuals in same-sex couples in the U.S. This report builds on previously released studies in which the Williams Institute provided a separate analysis of API, African-American, and Latino/a individuals in same-sex couples.
Geographic Distribution
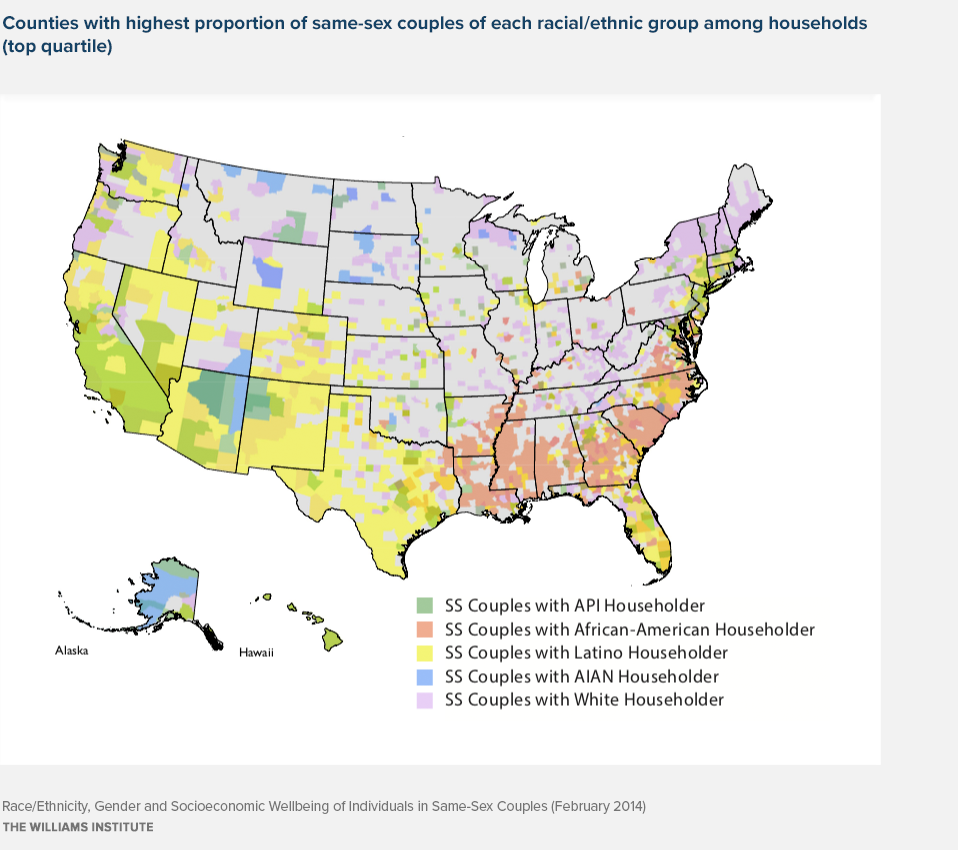
Individuals of each racial and ethnic group who are in cohabiting same-sex couples tend to live in areas where there are higher proportions of individuals of their own race or ethnicity.
This county-level map uses U.S. Census 2010 data measuring same-sex couples. We highlight the top 25% of counties with the highest proportion of same-sex couples of each racial/ethnic group among all households. For example, the red shaded counties indicate the counties with the highest proportion of same-sex couples with an African-American householder. While there are counties that overlap, API individuals in same-sex couples are mainly situated on the west coast, Latinos/as in the Southwest, African-Americans in the South, AIAN in the Mountain states, and Whites in the Northeast.
Key Findings
- Racial/ethnic minority individuals in same-sex couples tend to live in areas where there are higher proportions of individuals of their own race or ethnicity. Thus, the geographic distribution of racial/ethnic minority same-sex couples tends to mirror the respective distribution of racial/ethnic minority populations generally.
- Among same-sex couples, African-American, Latino, and AIAN respondents have lower-incomes, lower college completion rates, and higher unemployment rates than White and API respondents.
- Regardless of race or ethnicity, individuals in same-sex couples have higher unemployment rates and higher rates of college completion compared to their counterparts in different-sex couples.
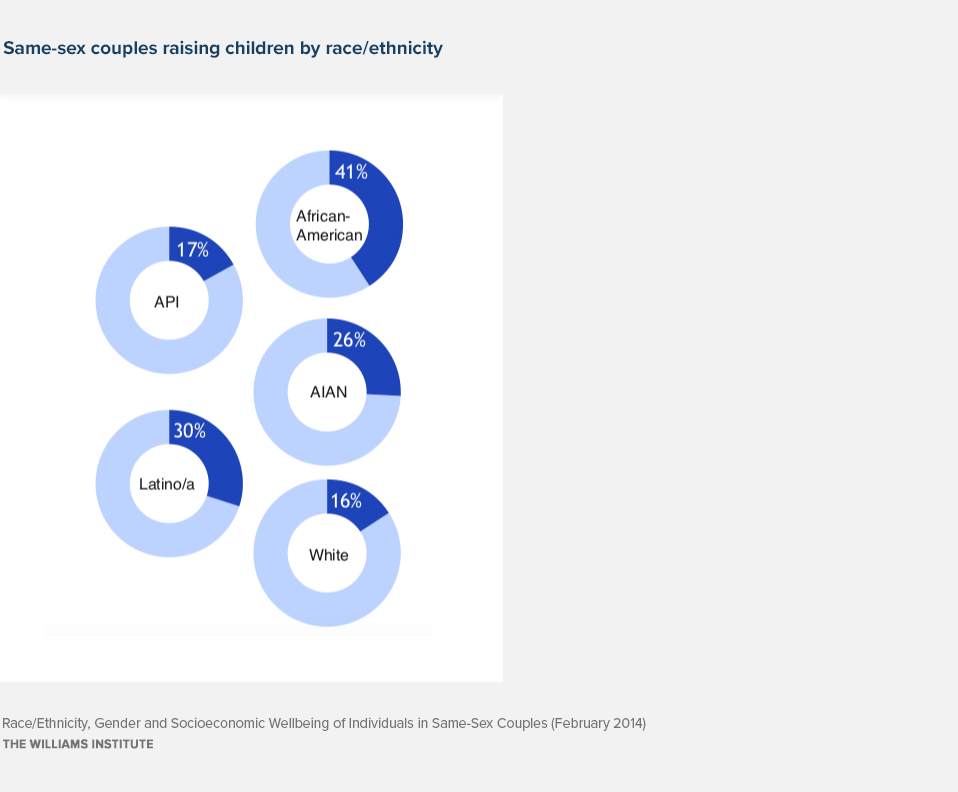
- About 1 out of every 3 individuals in same-sex couples raising children are people of color. Racial/ethnic minority individuals in same-sex couples are more likely to have kids compared to White individuals in same-sex couples.
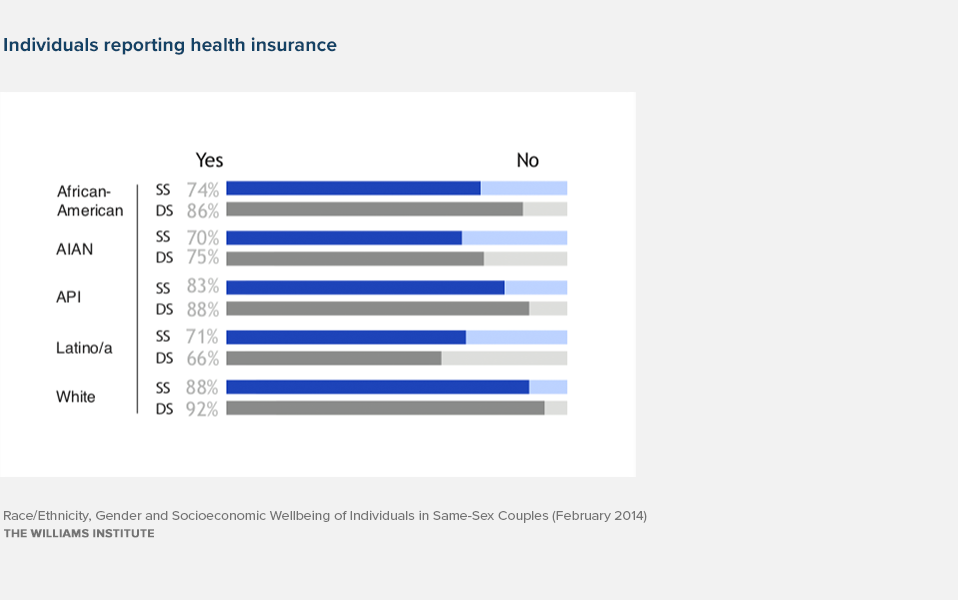
- Among same-sex couples, AIAN and Latino/a individuals in same-sex couples are the least likely (70%, 71%) to be covered by health insurance. Health insurance rates are generally lower for individuals in same-sex couples compared to their counterparts
in different-sex couples.
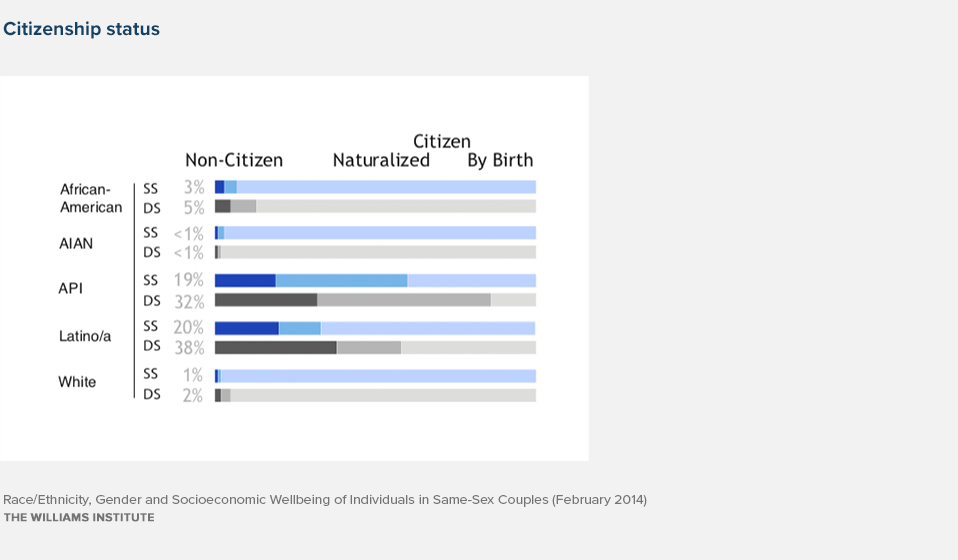
- 1 out of 5 Latino/a and API individuals in same-sex couples are non-citizens (20%, 19%). In general, individuals in same-sex couples are more likely to be U.S. citizens (by naturalization or birth) than those in different-sex couples.
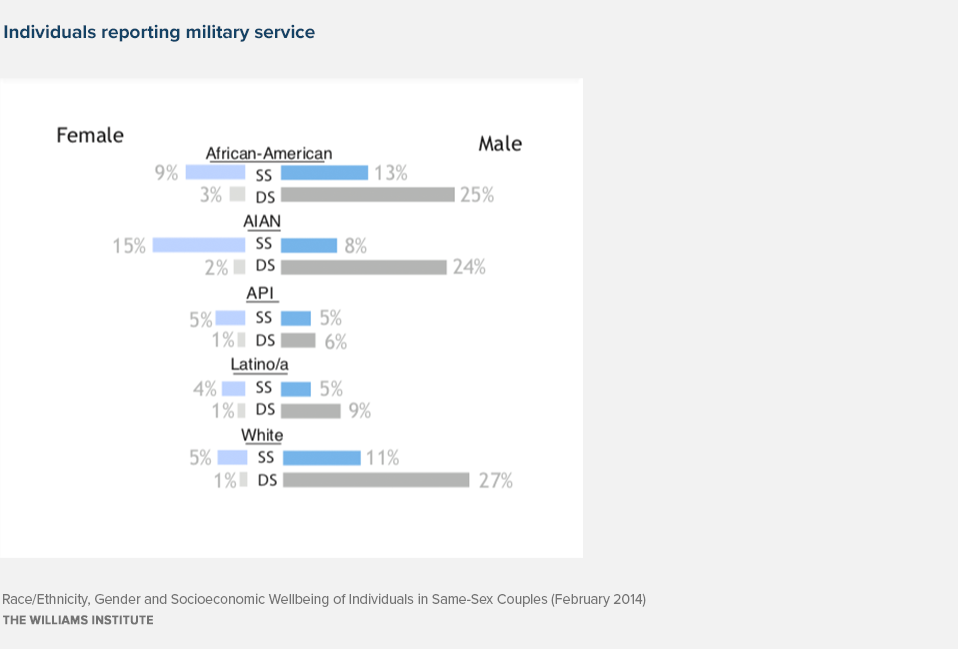
- Women in same-sex couples are much more likely to report military service than those in different-sex couples, with AIAN and African-American women the most likely (15%, 9%).
- Overall, individuals in same-sex couples are 2.2 times more likely to partner with individuals of another race/ethnicity compared to people in different-sex couples.
Household Composition
Partnership Patterns
Individuals in same-sex couples are more likely to partner with individuals of another race/ethnicity compared to people in different-sex couples. This pattern is consistent across racial/ethnic groups. However, this pattern is most evident with API individuals, where only 20% of API individuals in same-sex couples partner with another API person, compared to almost 70% of API individuals in different-sex couples. In contrast, 79% of White individuals in same-sex couples are partnered with another White individual, compared to 90% of White individuals in different-sex couples. Below, we indicate the proportion of individuals that partner with someone of the same race/ethnicity, someone who is a person of color (POC) outside their same race/ethnicity, or someone who is White.

Raising Children
Generally, racial/ethnic minorities in same-sex couples are more likely to be raising children than White respondents in same-sex couples. About 1 out of every 3 individuals in same-sex couples raising children are people of color. African-Americans in same-sex couples are most likely to be raising children, while White individuals are the least.
Note on Reporting Racial/Ethnic Data
In our analyses, we found that intra-ethnic differences exist within various racial/ethnic groups, oftentimes indicating a large disparity between subpopulations. For example, while API individuals in same-sex couples appear to be faring well socioeconomically, differences in college completion rates by ancestry or ethnicity paint a more complex picture. This may obscure the needs of subpopulations within each community.
For the sake of interpretation, it is also important to keep in mind that these data help to provide evidence that race and ethnicity matter when thinking about economic stability and health care access, including among individuals in same-sex couples. Because our analyses controlled for variables such as education, income, and age, when making statements about ethnic and racial differences, the data do suggest that race/ethnicity plays a unique and significant role. However, they do not tell us how and why it matters or provides recommendations for how to resolve disparities. Numerous scholars remind us that race/ethnicity serves as a proxy for both systemic and psychological racism, as well as a host of structural and cultural factors (e.g., Helms, 2005).
Characteristics of Individuals in Same-Sex Couples
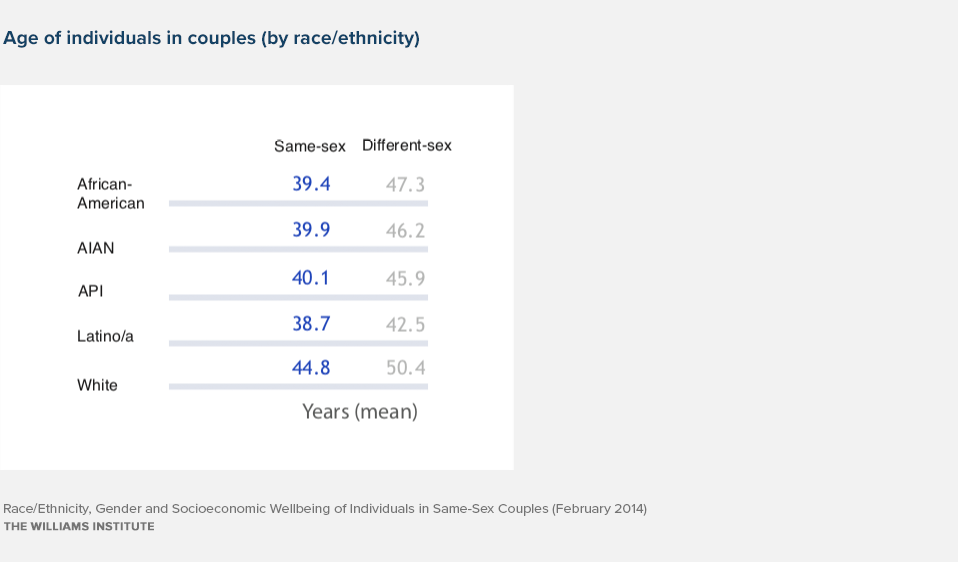
Gender and Age Distribution
There are significant differences in the gender of same-sex couples across racial/ethnic groups. The majority of African-American and AIAN individuals in same-sex couples are female, while the majority of Latino/a and API individuals in same-sex couples are male. Notably, 2/3 of all API individuals in same-sex couples are male. With regards to age, individuals in same-sex couples are younger than their counterparts in different-sex couples for every racial/ethnic group. There are also differences in age across respondents in each race/ethnic group, regardless of couple-type. For example, Latino/a individuals in same-sex couples are the youngest on average (38.7 yrs), while White individuals are the oldest (44.8 yrs). This pattern is also evident for individuals in different-sex couples (42.5 yrs, 50.4 yrs).

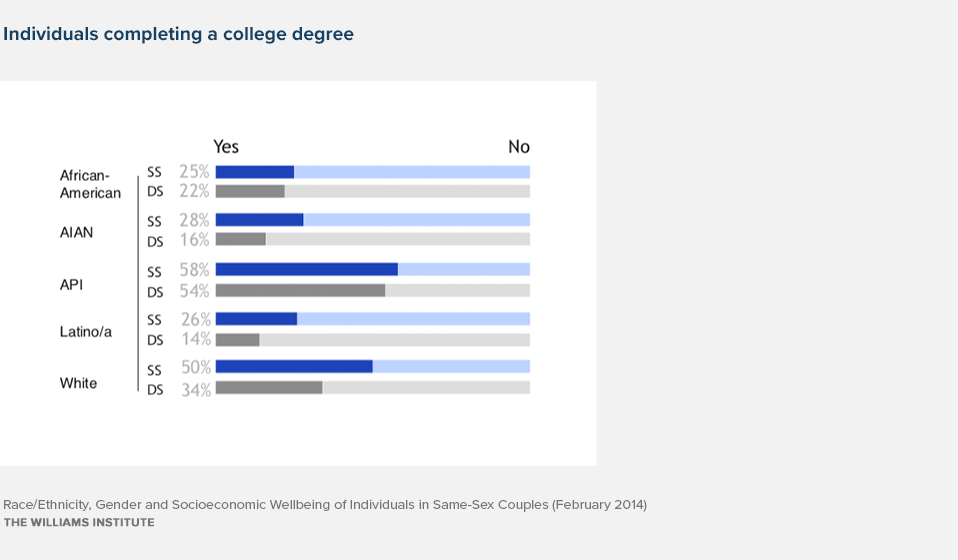
Completed a College Degree or More
Overall, individuals in same-sex couples are more likely to have completed a college degree than their counterparts in different-sex couples. However, White and API individuals are about twice as likely (50%,58%) than Latino/a (26%), African-American (25%) and AIAN individuals (28%) in same-sex couples to have a 4-year degree. In addition, the gap in educational attainment between individuals in same-sex couples and different-sex couples is smallest for African-American and API individuals (3-4%), and the largest for Whites (16%). It is important to note that there are differences in educational attainment by ancestry within racial/ethnic groups as well, specifically in Latino/a and API communities.
By Gender
The tendency for respondents in same-sex couples to have higher rates of college completion than those in different-sex couples generally held true regardless of the gender of the couple. One exception was in the case of African-American women in same-sex couples who report similar college completion rates to their counterparts in different-sex couples (~24%).
Covered by Health Insurance
Generally, individuals in same-sex couples are less likely to be covered by health insurance than their counterparts in different-sex couples. However, Latino/a individuals in same-sex couples are more likely to report having health insurance than Latinos/as in different-sex couples (71% vs. 66%). Among respondents in same-sex couples, there are racial/ethnic differences in level of coverage. AIAN and Latino individuals in same-sex couples report the lowest proportion covered by health insurance, while White individuals report the highest.
Military Status
In general, men are much more likely than women to serve in the military. However, men in same-sex couples are less likely to report military service than those in different-sex couples. For some racial/ethnic groups, men in same-sex couples still report relatively high rates of inclusion in the military. Women in same-sex couples are much more likely to report military service than those in different-sex couples, with AIAN and African-American women the most likely (15%, 9%).
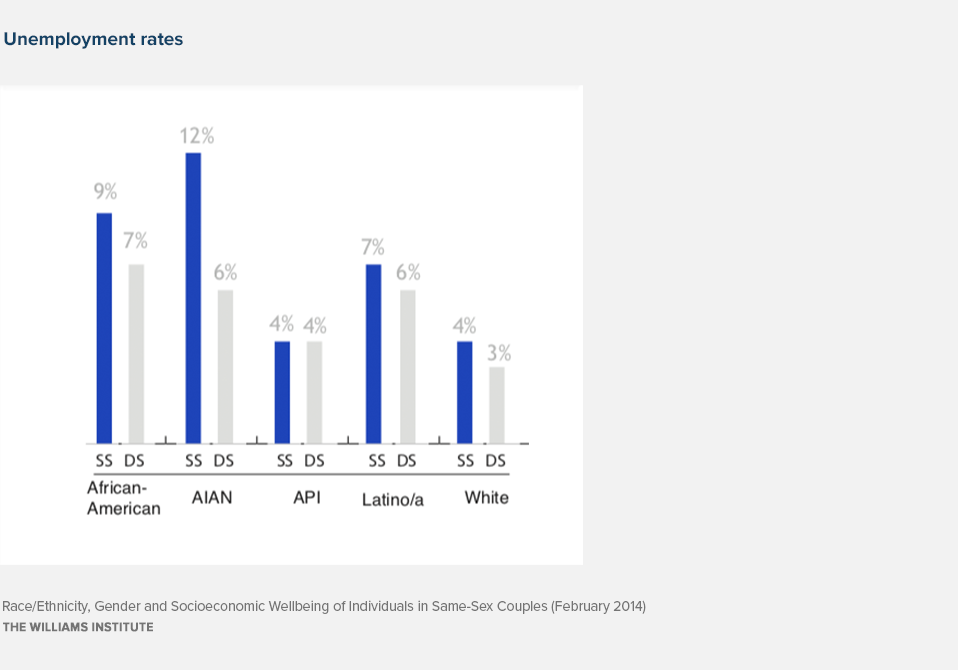
Employment Status
Unemployment rates are generally higher for individuals in same-sex couples compared to their counterparts in different-sex couples. Only API individuals in same-sex couples report similar unemployment rates to those in different-sex couples (4%). AIAN individuals are 3 times more likely to be unemployed (12%) than White and API individuals (4%).
Citizenship Status
While individuals in same-sex couples are more likely to be U.S. citizens (by naturalization or birth) than those in different-sex couples, about 1 out of 5 Latino/a and API individuals in same-sex couples are non-citizens (20%, 19%). For Latino/a individuals raising children, about 1 in 3 individuals in same-sex couples are non-citizens (33%).
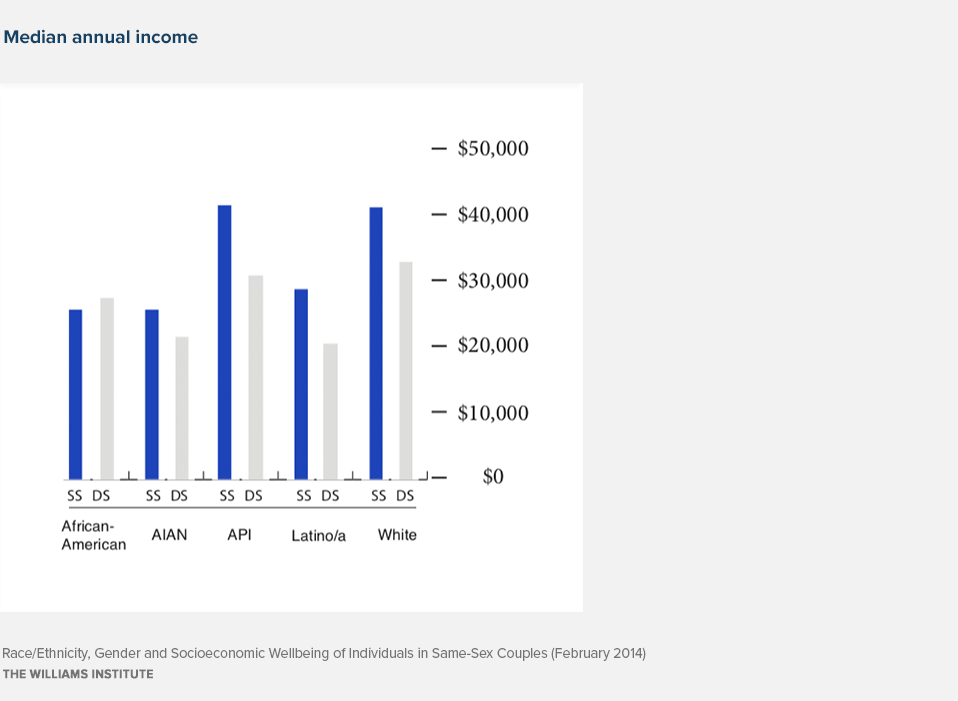
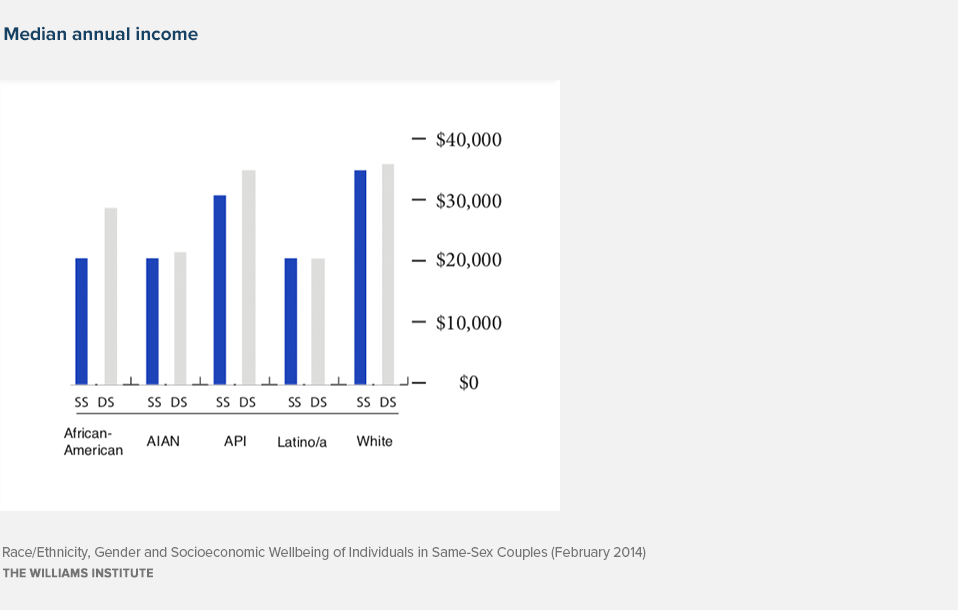
Median Individual Income
Individuals in same-sex couples generally report higher median incomes than their counterparts in different-sex couples. Only African-American individuals in same-sex couples report lower median incomes than African-Americans in different-sex couples. Among same-sex and different-sex couples, API and White individuals in same-sex couples report the highest median incomes ($40,300; $40,000). Notably, African-American and AIAN individuals in same-sex couples report making about 63% of what API and White individuals make annually ($25,000).
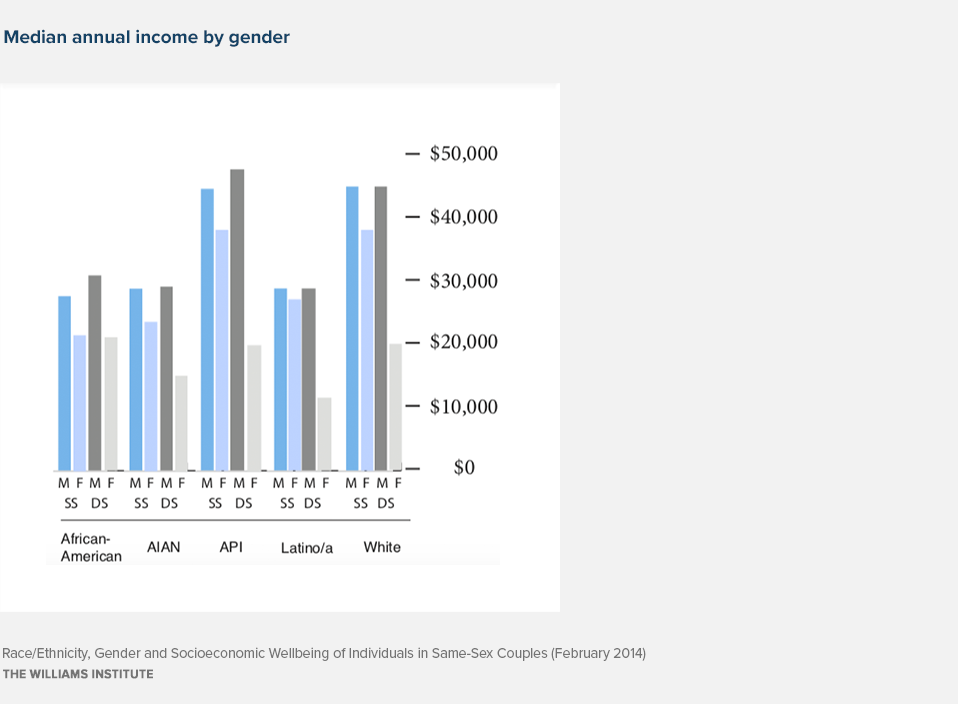
By Gender
Females in same-sex couples and different-sex couples report lower median incomes than males. African-American and API males in same-sex couples report lower median incomes than those in different-sex couples ($27,000 vs. $30,500; $44,000^ vs. $47,000^), while AIAN, Latino/a and White males report similar incomes to those in different-sex couples. Most females in same-sex couples make more than those in different-sex couples. Only African-American women in same-sex couples report similar annual incomes compared to their counterparts in different-sex couples (~$22,000).
Characteristics of Individuals Raising Children
In this section of the report, we focus on individuals of each racial/ethnic group who are in couples raising children. Individuals in racial/ethnic minority groups are more likely to be raising children, but only a third of all individuals in same-sex couples raising children are people of color (35%). Individuals in couples with children generally fare worse with regards to educational attainment, insurance coverage and median income. This is especially true for individuals in same-sex couples.
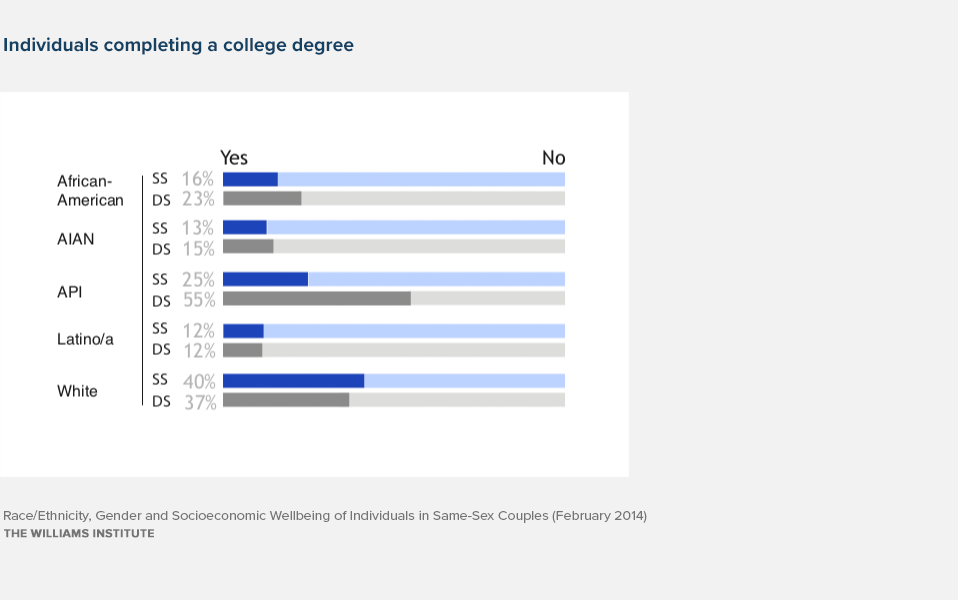
Completed a College Degree or More
While individuals in same-sex couples are more likely to have completed a college degree than their counterparts in different-sex couples, people of color in same-sex couples with children are generally less likely to have a college degree compared to those in different-sex couples. AIAN and Latino/a individuals are least likely to have a college degree (13%, 12%). For API individuals in same-sex couples, educational attainment drops from 58% to 25% if they are raising children.
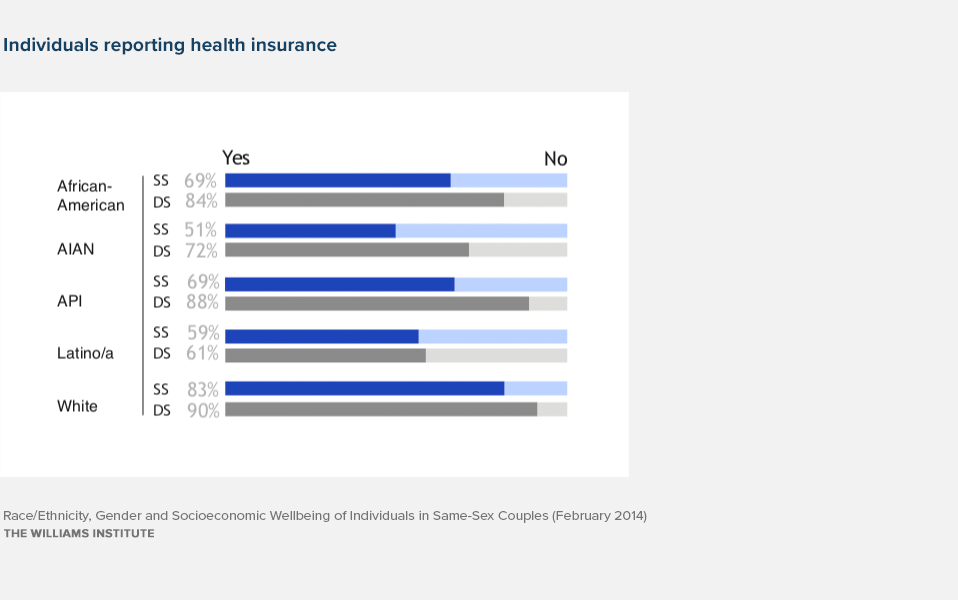
Covered by Health Insurance
As mentioned earlier, individuals in same-sex couples are less likely to be covered by health insurance than their counterparts in different-sex couples. This is especially true for couples raising children. AIAN and Latino/a individuals in same-sex couples are least likely to have insurance (51%, 59%), while White individuals are the most likely (83%). The largest gap between individuals in same-sex and different-sex couples, 21%, exists for AIAN individuals.
Median Individual Income
Individuals in same-sex couples raising children report similar or lower median incomes than their counterparts in different-sex couples. African-American individuals in same-sex couples raising children report much lower median incomes than those in different-sex couples ($20,000 vs. $29,000). For AIAN, Latino/a and White individuals, there is no statistical difference between the median income of those in same-sex couples compared to those in different-sex couples. African-American, Latino/a and AIAN individuals in same-sex couples raising children report similar low incomes (~$20,000), while API and White individuals report higher incomes ($30,000, $34,000).
By Gender
Generally, females in same-sex couples raising children report higher median incomes than females in different-sex couples. Only African-American females in same-sex couples raising children report lower median incomes than those in different-sex couples ($20,000 vs. $24,000). White and API females in same-sex couples raising children report the highest incomes ($36,000, $33,150). Males in same-sex couples raising children report similar or lower median incomes than males in different-sex couples and females in same-sex couples.
Implications
Discussion
Overall, the findings indicate a generally consistent pattern in which individuals with marginalized social statuses, such as sexual minorities, racial/ethnic minorities, and women, experience exaggerated economic and health care access disparities. However, the ways the intersection of these social categories (i.e., race, sexuality, gender) matter differs by outcome of interest and highlights the need for research using frameworks that address the intersections of multiple forms of oppression and cultural systems.
Implications of Socioeconomic Disparities
For example, individuals in same-sex couples are more likely to have completed a college degree than their counterparts in different-sex couples. Yet, racial disparities remain among same-sex couples in that White and Asian/Pacific Islander individuals are about twice as likely as Latino/a, African-American, and American Indian/Alaskan Native individuals to have obtained a college degree.
Further, these differences in access to economic stability are observed in the areas of income and employment, where we see that racial disparities in income and employment among individuals in same-sex couples reflect the same pattern that is typically observed in different-sex couples. For example, African-American, Latino/a, and American Indian/Alaskan Native respondents in same-sex couples have lower incomes and higher unemployment rates than White and Asian/Pacific Islander respondents.
The similarity between these findings and previous studies on ethnic difference in socioeconomic outcomes among (presumably) majority heterosexual samples highlight a need to make racial justice work a priority and target impacts of heterosexism, sexism, and racism to improve the lives of individuals in same-sex couples, and other sexual minorities. Specifically, the tendency for racial/ethnic minority individuals in same-sex couples to live in areas with high concentrations of their racial/ethnic group support the idea that policies centered on supporting neighborhood education and economic development make sense as a key part of LGBTQ advocacy work that aims to reduce racial/ethnic disparities in wellbeing. Additionally, the strong relationship between community unemployment rates and military service, combined with the high representation of racial/ethnic minority women in same-sex couples in the military, highlights a potential subgroup in need of assistance with educational and economic development before and after entering the military.
Implications of Household Composition
The data also indicate other notable patterns regarding the composition of families with same-sex couplings. For example, individuals in same-sex couples are more likely than those in different-sex couples to be in interracial couplings. It could be reasonable to hypothesize that these differences in interracial dating patterns are in part a function of availability of same-sex people within a person’s given racial/ethnic group. However, there are also likely factors related to cultural views on interracial dating among sexual minorities (meaning, a higher acceptance or interest), as well as social access to partners outside of one’s race that count for some of these differences.
Further, though people in same-sex couples appear to be more likely to be in interracial relationships, the patterns between racial/ethnic groups are quite similar to that of different-sex couples found in previous research. Other studies have found that, out of people of color, Asian/Pacific Islander individuals are more likely to have interracial marriages/couplings, and that White people are least likely. Therefore, the data indicate a combination of adherence to racial/ethnic cultural norms regarding interracial dating patterns and potential influence of an LGBTQ culture on openness to interracial relationships.
Another important area of family life found in this study was the relevance of raising children on the economic stability of couples. Individuals in couples with children generally fare worse with regards to educational attainment, insurance coverage, and median income. Again indicating the significance of couple type, the data also showed that this effect was exaggerated for individuals in same-sex couples. Though people in same-sex couples were less likely overall to have children than individuals in different-sex couples, over a third were raising children in their home. Further, racial/ethnic minority individuals in same-sex couples are more likely to have children compared to White individuals in same-sex couples. The racial/ethnic difference in child-rearing identified here seems to reflect trends in birth rates across the country where data have generally indicated a lower likelihood of having children among Whites compared to ethnic minorities.
However, trends among ethnic minorities in same-sex couples differ slightly from national trends in that African-Americans are more likely to have children compared to Latinos/as; actually, African-Americans in same-sex couples had a rate of raising children much closer to their different-sex counterparts than any other group. There is likely an interaction between structural and cultural factors affecting decisions to raise children that account for the sexual identity and racial/ethnic related differences observed here. These data further indicate the need for public policies that aim to support families with children in achieving educational and economic goals in ways that simultaneously support racial/ethnic and sexual orientation equity.
Download the brief