Executive Summary
The Jacksonville-Area Community Assessment was initiated to learn about the composition, experiences, and needs of Northeast Florida’s large and diverse lesbian, gay, bisexual, transgender, and intersex (LGBTI) community. Between August and November 2017, 671 LGBTI adults who lived, worked, prayed, played, or received services in Jacksonville in the prior year completed anonymous, English-language surveys. Nearly all surveys were completed online. Information about the survey was distributed across Northeast Florida by four outreach assistants and members of the Community Advisory Board assembled to guide this project. Survey respondents were diverse by age, sex, gender, race, sexual orientation, and gender identity, among other characteristics. Two thirds (65.6%) had lived in one of the five counties of Northeast Florida for more than 10 years.
Demographics
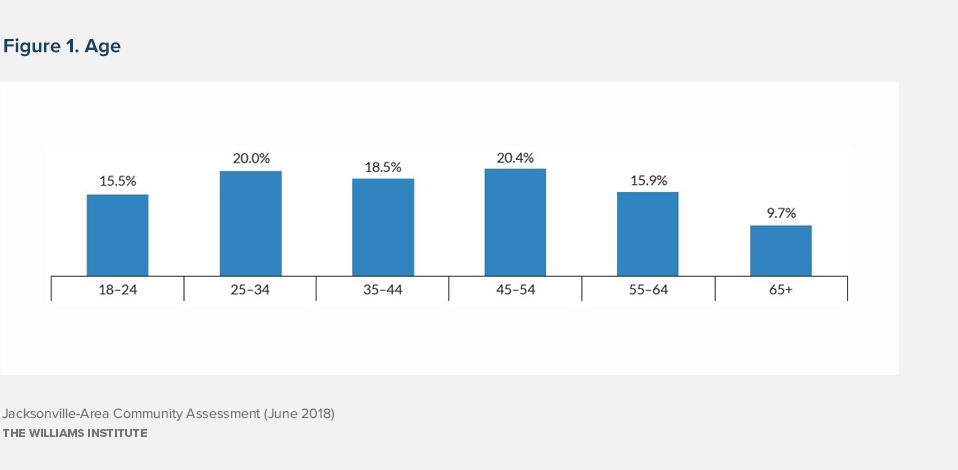
- As shown in Figure 1, respondents were young, middle-aged, and older.
- Similar proportions of respondents were assigned female sex at birth as male (47.5% and 50.9%, respectively), with 1.6% of respondents identifying as intersex.
- Approximately 13.5% of respondents were gender minorities (individuals whose current gender identity differs from their sex assigned at birth) and the majority (86.5%) was cisgender (individuals whose current gender identity and assigned sex at birth is the same).
- A majority (70.4%) of respondents identified as lesbian or gay, 17.6% identified as bisexual, 9.6% as queer, 1.3% as asexual, and 1.0% as straight.
Socioeconomic Characteristics
- Many respondents reported high levels of formal educational attainment; over half (56.4%) had a bachelor’s, graduate or professional degree, and about one in ten (9.4%) respondents had a high school or GED diploma.
- Approximately three quarters (74.3%) of respondents were employed for wages or self-employed; 11.0% were retired, 6.1% were students, 4.6% were out of work, 2.8% were unable to work, and 1.0% were homemakers.
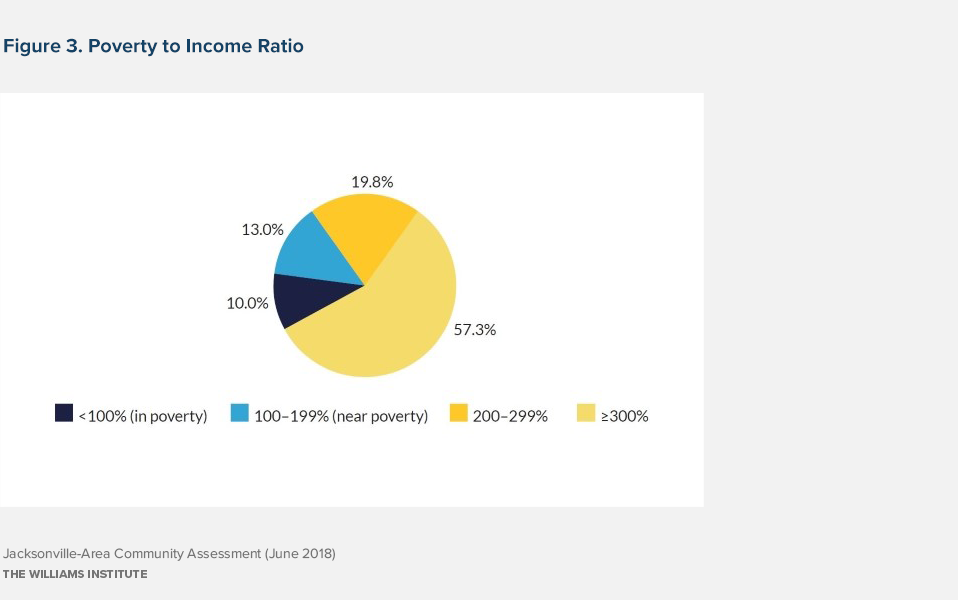
- As shown in Figure 3, although nearly a quarter (24.3%) of respondents reported annual household incomes of $100,000 or more, 10% of respondents were living in poverty (living below 100% of the federal poverty level), and another 13.0% of respondents were “near poor” (living at 100-199% of the federal poverty level).
- Among respondents assigned female at birth, about one quarter reported household incomes at the poverty (10.5%) or near poverty (16.0%) levels.
- Approximately one in five (21.8%) respondents reported food insecurity in the last 12 months (cutting or skipping meals because of insufficient money for food).
- Among gender minorities, 20.0% reported being out of work, more than half (52.2%) reported food insecurity in the last twelve months, and two-thirds reported household incomes at the poverty (32.2%) or near poverty (34.5%) levels.
Relationship and Family Characteristics
- Over sixty percent (62.8%) of respondents reported being in “partnered” relationships; about half of cisgender respondents reported having a cisgender partner of the same sex assigned at birth, and between a fifth and a quarter of gender minority respondents reported having a gender minority partner.
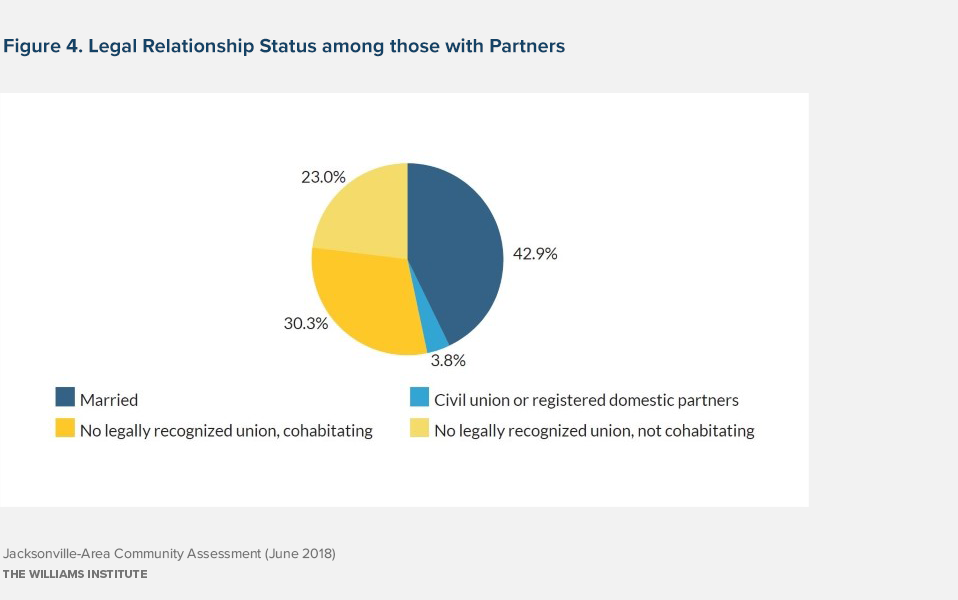
- As shown in Figure 4, over forty percent (42.9%) of those with partners were married.
*Denotes responses that have been suppressed because of small sample size
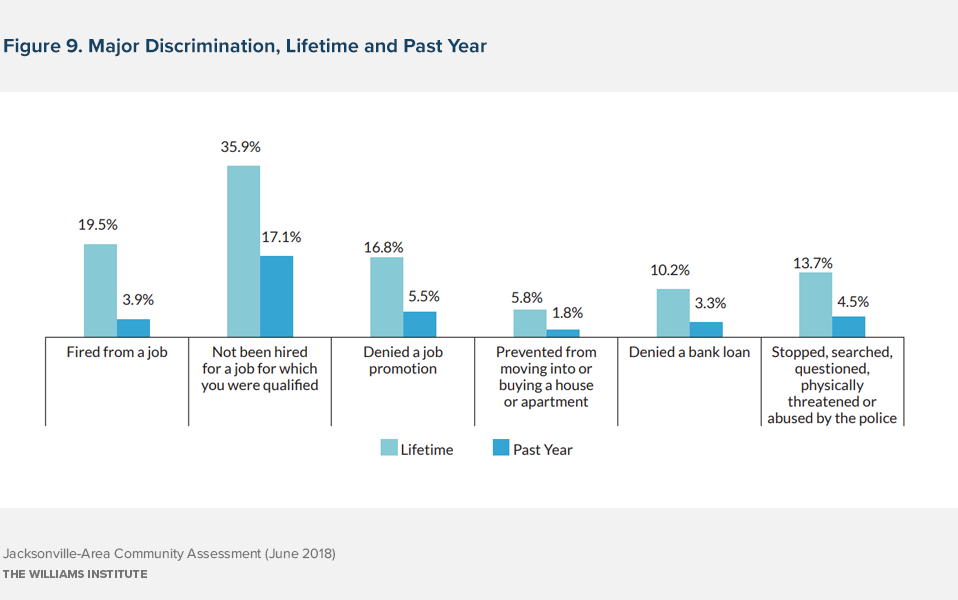
- African American respondents were more likely to report having been unfairly treated in being fired from a job (10.7%), denied a job promotion (8.8%), denied a bank loan (11.5%), and being stopped, searched, questioned, physically threatened, or abused by the police (10.1%) in the past year than white respondents.
- Gender minority respondents were more likely to report having been unfairly treated in being fired from a job (8.3%), not being hired for a job for which they were qualified (34.9%), and being denied a job promotion (15.7%) in the past year than cisgender respondents.
- Older respondents were less likely than respondents ages 18-54 to have reported being unfairly fired, not hired for a job for which they were qualified (9.9%), denied a job promotion, prevented from moving into or buying a house or apartment (0.0%), denied a bank loan (0.0%), and stopped, searched, questioned, physically threatened, or abused by the police in the past year.
- Respondents identified many different reasons why they believe they were treated unfairly. The most frequently cited reason for these experiences was the respondent’s sexual orientation.
- African American respondents, gender minority respondents, and respondents assigned female at birth in the sample attributed employment discrimination experiences to many causes; however, they were also more likely to report employment discrimination due to race, gender expression or transgender status, or sex, respectively, than other respondents.
- Among those who reported experiences of discrimination, few sought legal recourse.
Perceptions of Jacksonville and Northeast Florida
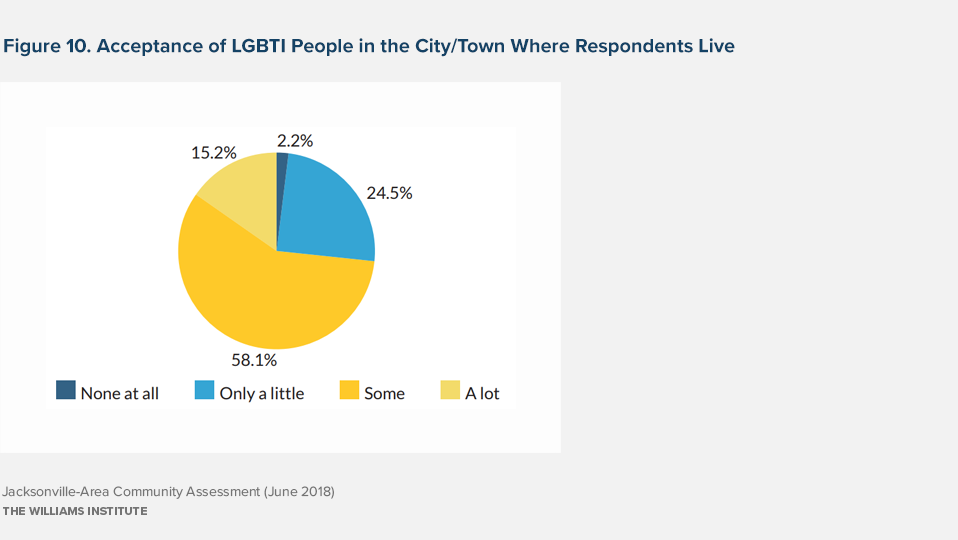
- As shown in Figure 10, a majority (73.3%) of respondents indicated that they felt there was at least some acceptance of LGBTI people in the city or town where they lived, including 58.1% who reported that there was some acceptance and 15.2% who indicated that there was a lot of acceptance; however, just over a quarter (26.7%) of the sample reported that there was only a little (24.5%) or no acceptance (2.2%) in these places.
