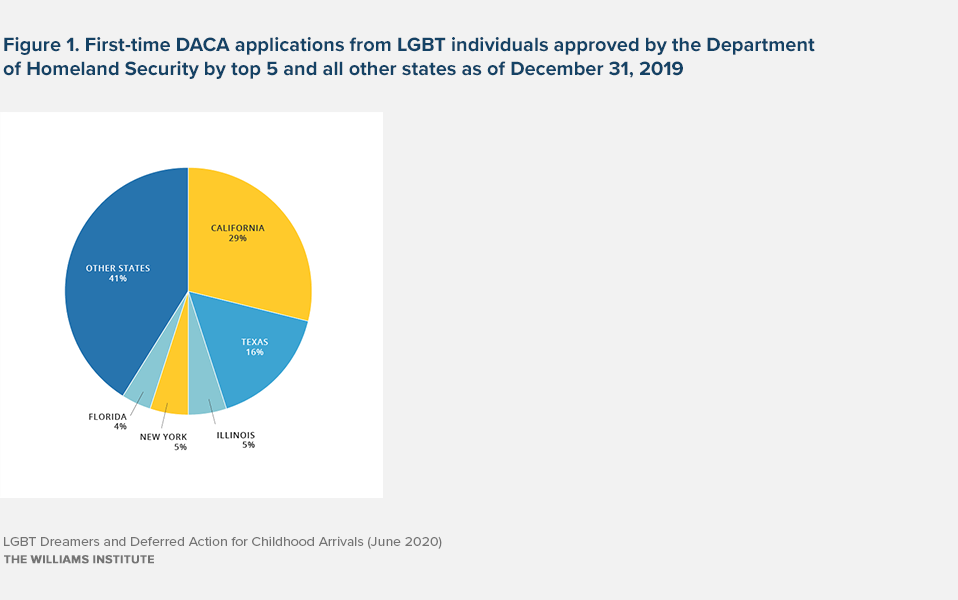
There are an estimated 81,000 LGBT Dreamers in the U.S., including about 39,000 who have participated in Deferred Action for Childhood Arrivals (DACA). Most LGBT DACA participants live in California, Texas, Illinois, New York, and Florida.
Brief
LGBT ‘Dreamers’ and Deferred Action for Childhood Arrivals (DACA)
June 2020
This brief provides estimates of the number of LGBT people participating in the Development, Relief, and Education for Alien Minors Act, also known as the DREAM Act, and the number of them who have enrolled in the Deferred Action for Childhood Arrivals (DACA) program.
Highlights
DACA provides undocumented immigrants who entered the U.S. before age 16 temporary work authorization and protection from deportation.
There are 81,000 LGBT Dreamers and 39,000 of them have participated in DACA.
Most LGBT DACA participants live in California, Texas, Illinois, New York, and Florida.
Brief
In June 2012, then-President Obama’s administration announced the creation of the Deferred Action for Childhood Arrivals (DACA) program, which provided undocumented immigrants who entered the United States before the age of 16, and met other requirements, temporary work authorization and protection from deportation for a renewable two-year period. This cohort of youth and young adults is often referred to as Dreamers, in reference to the proposed Development, Relief, and Education for Alien Minors Act. The DREAM Act would provide permanent legal status for Dreamers.
In September 2017, five years after the program’s creation, the Trump administration rescinded the June 2012 memorandum and announced a winding down of the DACA program. Immediately following the announcement, the U.S. Citizenship and Immigration Services (USCIS) ceased to accept new DACA applications. Later, on October 5, 2017, USCIS stopped accepting DACA renewal applications as well. Challenges to the rescinding of DACA resulted in several federal courts ordering USCIS to continue accepting renewals, thus sustaining the program for those already enrolled. In 2019, the Supreme Court agreed to review the lower court decisions. A decision is expected by the end of June 2020.
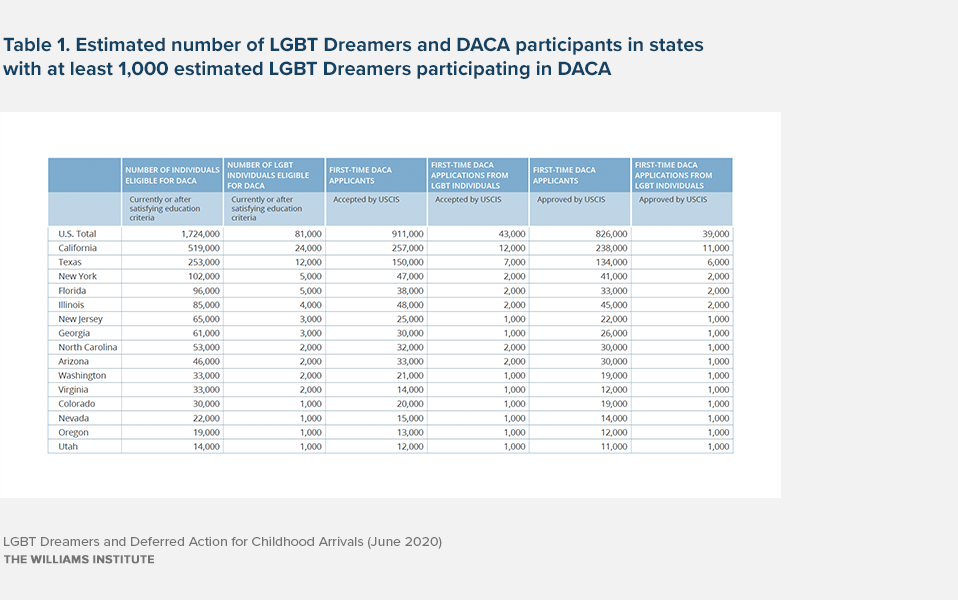
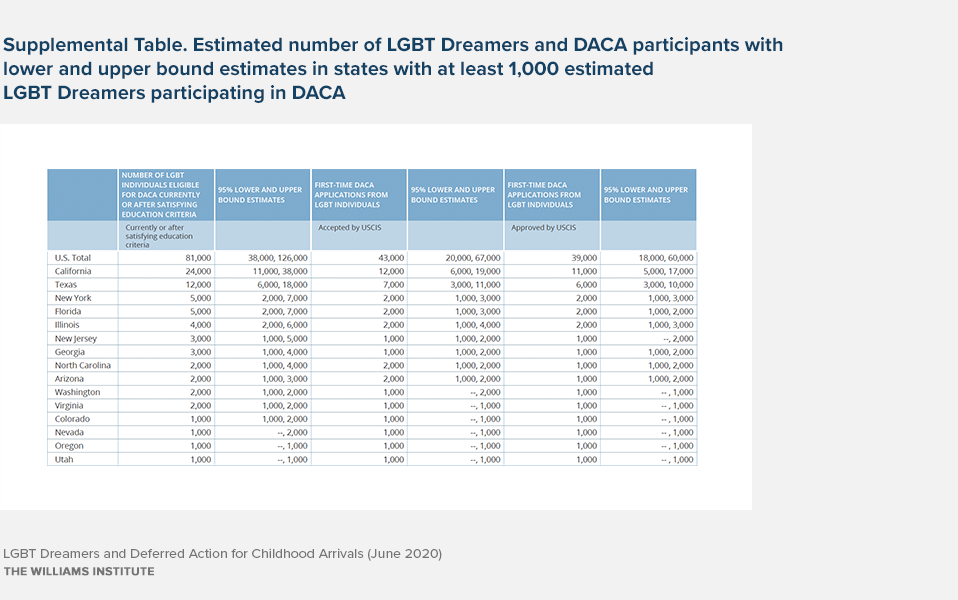
The Migration Policy Institute estimates that there are approximately 1,724,000 Dreamers who were eligible to participate in DACA, or would have been eligible if they satisfied the program’s educational requirements (e.g., enrollment in a GED program) and the program had not been terminated.
We estimate that approximately 81,000 of these Dreamers are LGBT.
The USCIS reports that, between the inception of the DACA program and December 2019, it accepted first-time applications from approximately 911,000 Dreamers (Table 1). Among first-time DACA applicants, we estimate that there are over 43,000 LGBT applicants including 39,000 who had their applications approved. The majority of DACA participants live in California, Texas, Illinois, New York, and Florida (Figure 1 above and Table 1 below).
DACA provides work authorization for a two-year period, thus reducing employment barriers for those who participate in the program. A 2019 study found that DACA participants report, on average, an 86% increase in hourly wages, from under $11 per hour pre-DACA enrollment to over $19 per hour afterward, and many also report getting a job with improved working conditions after enrolling in DACA. Enrollment in DACA can also expand educational opportunities. Some states allow DACA participants, but not other undocumented individuals, to enroll in colleges and universities in the state. Some states also allow DACA participants to qualify for in-state tuition and make available state-based financial aid. In 2019, the majority (71.2%) of DACA participants report pursuing educational opportunities that they would not have been able to access without DACA. Research suggests comparable benefits for LGBT and non-LGBT DACA participants.
Additional requirements include having entered the US prior to June 15, 2007 and resided in the US consecutively since that time, at least 15 years of age at application, and thus eligible for a criminal background check, under the age of 31 on June 15, 2012, and in-school or have completed high school or a GED or have been honorably discharged from the US Armed Services or Coast Guard. For full list see https://www.uscis.gov/humanitarian/consideration-deferred-action-childhood-arrivals-daca
Hipsman, F, Gomez-Aguiñaga, B, Capps, R. (2016). DACA at Four: Participation in the Deferred Action Program and Impacts on Recipients. Washington, DC: Migration Policy Institute.
We determined this estimate by multiplying the proportion of young adults, 18 to 29, who identify as LGBT and are undocumented (4.4%), as reported in Gates, GJ. (2013). LGBT Adult Immigrants in the United States. Los Angeles, CA: Williams Institute, to the (rounded) number of individuals eligible for DACA, as estimated by the Migration Policy Institute in Hipsman et al (2016). We believe that 4.4% is a conservative estimate of the percentage of LGBT individuals among 15 to 34 year olds eligible for or participating in DACA (as of March 2016) because larger proportions of high school age youth identify as LGB than young adults. The national average for the percentage of high school students who identify as LGB is 8.0% (Kann, L, Olsen, EO, McManus, T, et al. Sexual Identity, Sex of Sexual Contacts, and Health-Related Behaviors Among Students in Grades 9-12—United States and Selected Sites, 2015. MMWR Surveillance Summary 2016; 65(No. SS-9):1-202). In addition, 4.3% of 18 to 34 year old non-citizen participants in the 2015 California Health Interview Survey self-identified as LGB as per a January 23, 2017 on-line retrieval from Ask CHIS (http://ask.chis.ucla.edu), again, suggesting that 4.4% LGBT is a reasonable, albeit conservative, estimate of the LGBT percentage.
Wong, TK, Richter, KK, Rodriguez, I, Wolgin, PE. (2015). Results from a Nationwide Survey of DACA Recipients Illustrate the Program’s Impact. Washington, DC: Center for American Progress.
Wong et al. (2015)
We determined this estimate by multiplying the proportion of young adults, 18 to 29, who identify as LGBT and are undocumented (4.4%), as reported in Gates (2013), by the actual number of DACA applicants accepted by DHS as reported in USCIS. Number of I-821D, Consideration of Deferred Action for Childhood Arrivals by Fiscal Year, Quarter, Intake, Biometrics and Case Status: 2012-2016 (March 31).