Executive Summary
In this report, we provide descriptive statistics on anti-transgender violent attacks using data from the 2022 U.S. Transgender Survey—the largest community-based survey of transgender/nonbinary people in the United States. Our analysis focuses on 83,368 respondents aged 18 and older who identified as transgender men, transgender women, or nonbinary. We describe the prevalence of physical attacks experienced in the year preceding their participation in the survey and patterns of victimization across demographic group, geographic residence, and transgender visibility (the extent to which people are identifiable as transgender).
Key Findings
An estimated 5.4% of USTS adult respondents reported experiencing any sort of physical attack in the year prior to completing the survey. Among those who experienced physical attack, half (50.5%) reported being attacked multiple times within that year.
Geography of Physical Attacks
- Respondents from the Northeast/New England region (3.9%) reported a significantly lower prevalence of physical attacks compared to those in the Northeast/Middle Atlantic (6.0%), West/Pacific (6.6%), and Midwest/West North Central (6.6%).
Demographic Characteristics of Victims of Physical Attacks
- The prevalence of physical attacks was generally similar across gender identities: 5.9% of transgender women, 5.2% of transgender men, 5.0% of nonbinary people who were assigned female at birth (AFAB), and 5.2% of those assigned male at birth (AMAB) reported experiencing a physical attack over the prior year.
- Transgender respondents over age 45 reported a significantly lower prevalence of experiencing a physical attack compared with those in the younger age groups (1.9% vs. 5.0% and more).
- No significant differences were observed in reported physical attacks between Black, non-Hispanic (4.7%) and white, non-Hispanic (4.7%) transgender adults, but Hispanic or Latine (6.4%) transgender adults, as well as those identifying as multiracial or another race (8.6%), were significantly more likely than white, non-Hispanic respondents to report experiencing one or more physical attacks.
- The higher respondents’ socioeconomic status, the less likely they were to have experienced physical attacks. About 8.3% of respondents with less than a high school degree reported physical attacks, compared to 3.6% among those with a bachelor’s degree. Similarly, transgender respondents with no income reported the highest prevalence of physical attacks (8.9%) among all income groups.
- Respondents who resided in suburban communities (4.3%) were the least likely to have experienced physical attacks in one year, compared with 6.7% in urban communities and 5.6% in rural communities.
- Nearly one in ten (9.0%) noncitizens reported experiencing one or more physical attacks, compared to 5.3% of respondents who were U.S. citizens.
The Context of Violence Against Transgender People
- Almost two-thirds of respondents (64.4%) reported that at least one of the attacks they experienced was related to their transgender identity. About one-third (31.7%) believed they were attacked because of their sexual orientation.
- The vast majority (71.5%) of respondents who reported experiencing a physical attack indicated that the assault involved grabbing, punching, or choking, and 21.8% of respondents reported experiencing a sexual assault.
Transgender Visibility as a Correlate of Physical Attacks
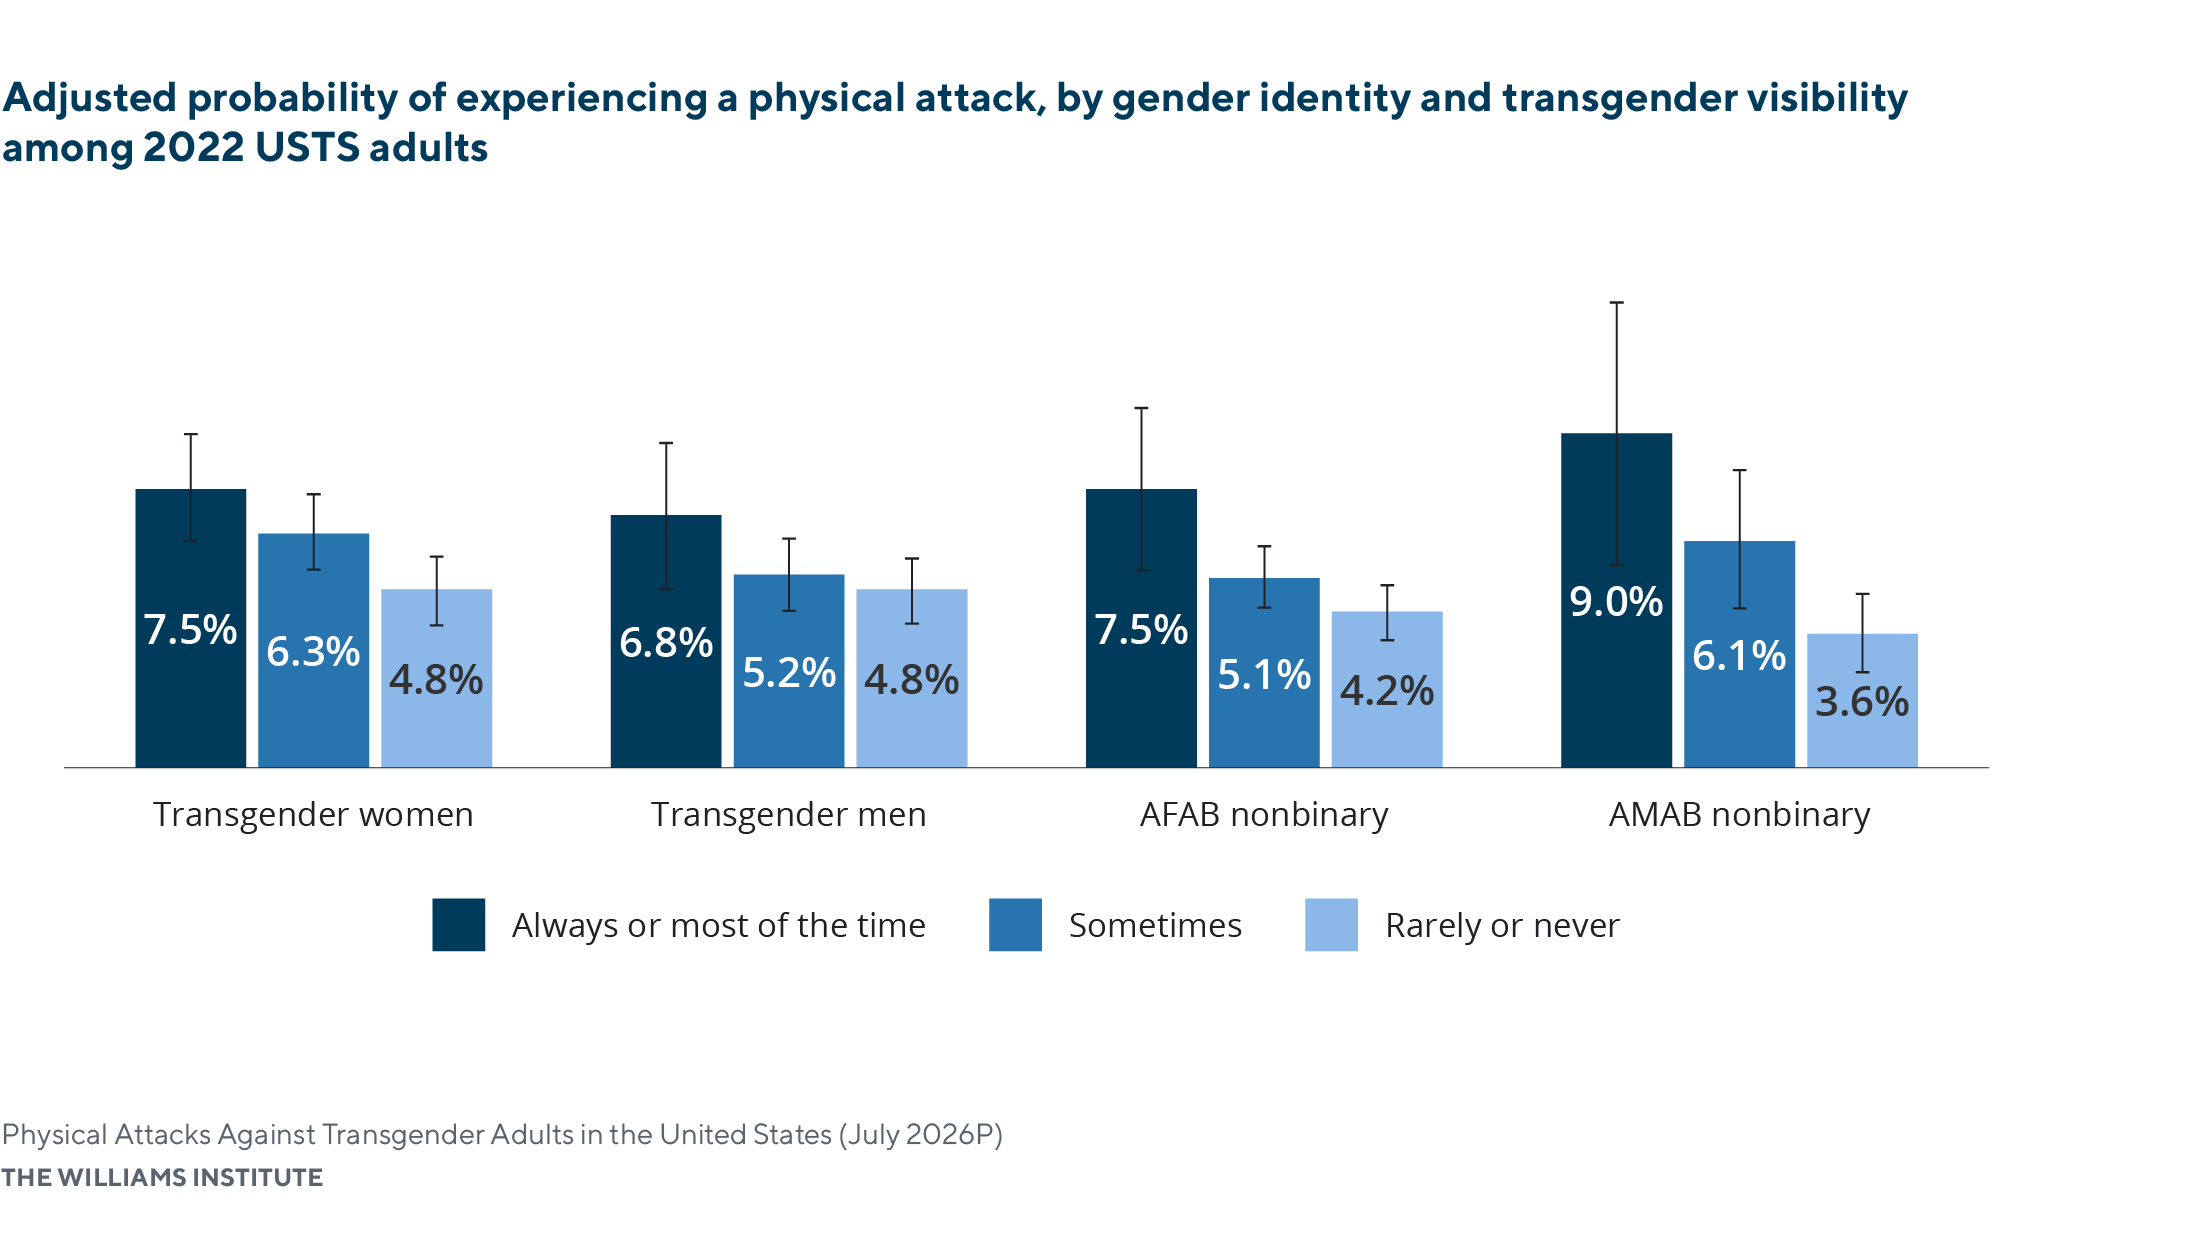
- Being visibly seen as transgender is a consistent correlate of physical attacks for all groups except transgender men. In general, those perceived as transgender most or all of the time have higher odds of experiencing a physical attack.