Overview
This report uses the best available data to provide a population estimate of LGBT Latino/a individuals and Latino/a same-sex (SS) couples in the United States, along with a general overview of their socioeconomic and demographic characteristics.
Geographic Distribution
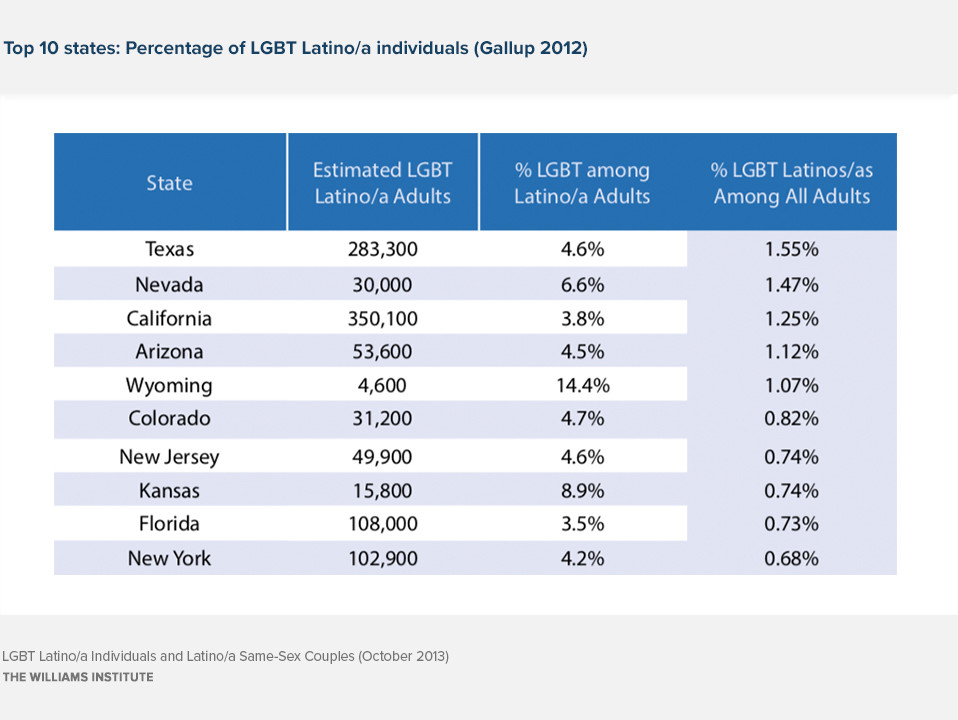
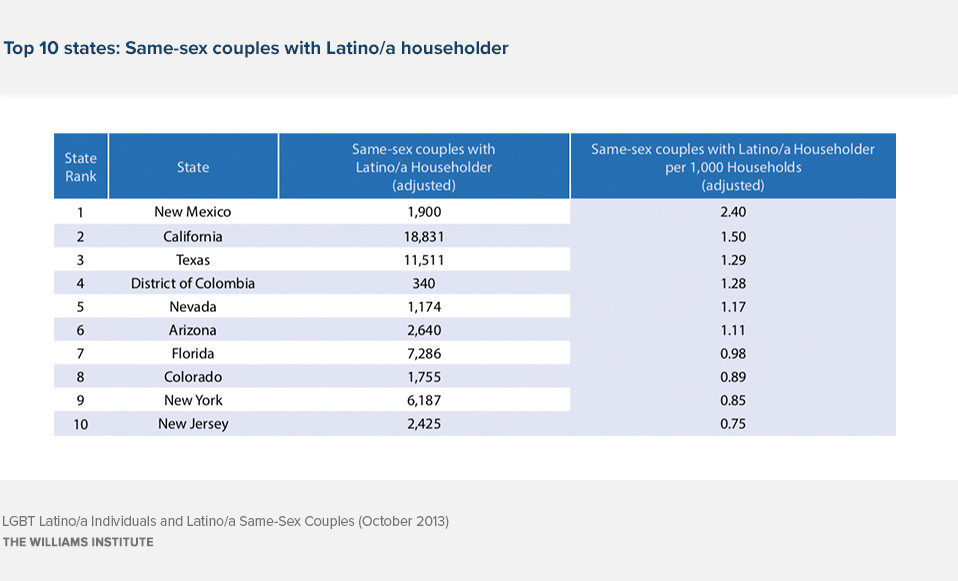
LGBT Latino/a adults tend to live in areas where there are higher proportions of Latinos/as, as opposed to areas with higher proportions of the broader LGBT population. Almost 1/3 of Latino/a same-sex couples live in New Mexico, California, and Texas.
The county-level maps use U.S. Census 2010 data measuring same-sex couples. The Census data describe both different-sex (DS) and same-sex (SS) couples by the race or ethnicity of the “householder,” who was Person 1 on the Census form. Person 1 is usually the person in whose name the home is either owned or rented. Appendix A contains a detailed description of who is included in each section of this snapshot report, along with additional information on how to understand the map key.
Source: U.S. Census 2010 data (adjusted)
Key Findings
- Overall, Latino/a individuals in same-sex couples are faring better than their different-sex counterparts. However, specific subpopulations show signs of socioeconomic vulnerability, such as Latina/female same-sex couples, couples raising children, and couples where one or both partners are non-citizens.
- 29.1% of all Latino/a same-sex couples are raising children. These families are living in counties all across the nation.
- Latino/male same-sex couples out-earn Latina/female same-sex couples by almost $15,000.
- In 63% of same-sex couples with a Latino/a partner, the other partner is not Latino/a. This is the case for only 32% of different-sex couples.
- LGBT Latino/a adults have higher rates of unemployment than non-LGBT Latino/a adults (14% vs. 11%). However, when only focusing on Latino/a individuals in same-sex couples, the rates are similar to their counterparts in different-sex couples.
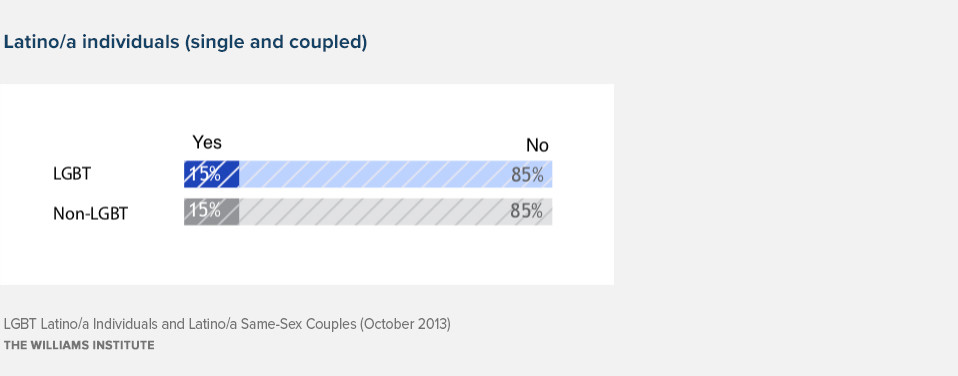
- An estimated 15% of both LGBT and non-LGBT Latino/a adults have completed a college degree. 26% of Latino/a individuals in same-sex couples have completed a college degree or more, compared to 14% in different-sex couples.
- Latino/a individuals in same-sex couples are more likely to be a U.S. citizen than their counterparts in different-sex couples (80% vs. 62%). Binational couples make up 1 of every 7 Latino/a same-sex couples. Furthermore, 1 in 5 Latino/a same-sex couples raising children have two non-citizen partners.

Source: U.S. Census 2010 data (adjusted)
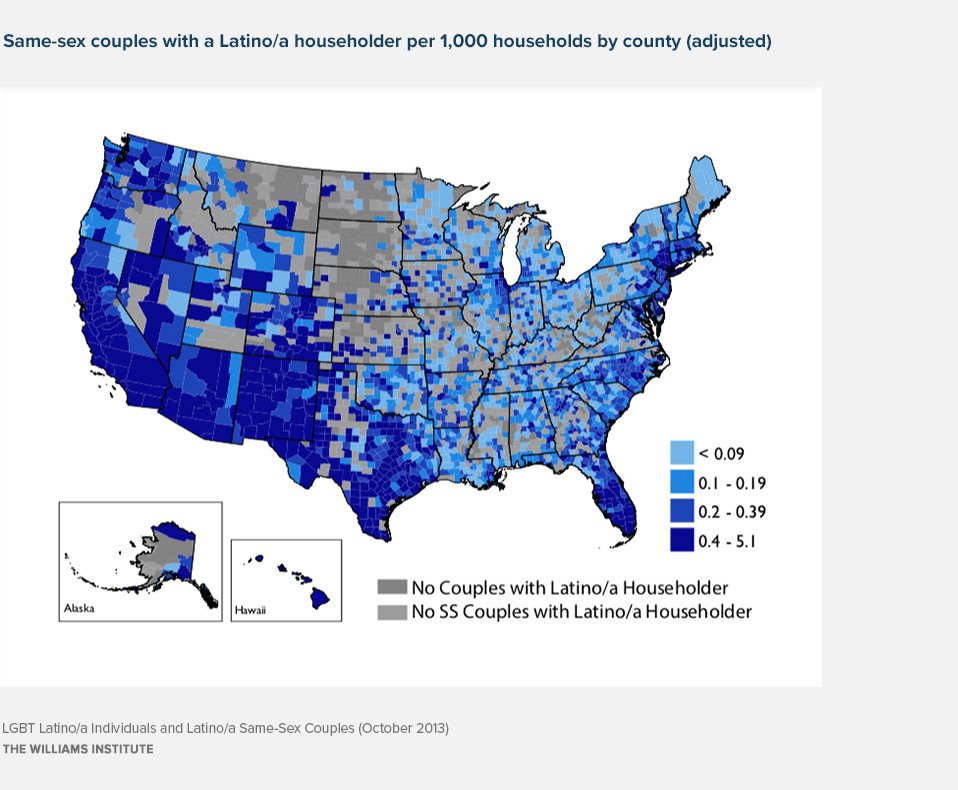
Latino/a Households
Nationally, 1 in 200 Latino/a households are led by a same-sex couple (0.5%). Counties where there is a higher proportion of Latino/a same-sex couples than the national average tend to be in areas where there are fewer Latino/a households overall, meaning the same-sex households make up a large part of the Latino/a population in those areas. With the exception of counties in the state of Florida, these counties tend to be in the South and Midwest regions of the country.
* “Own” children are never-married children under 18 who are sons or daughters of one partner or spouse (Person 1) by birth, marriage (stepchild), or adoption.
Source: U.S. Census 2010 data (adjusted)
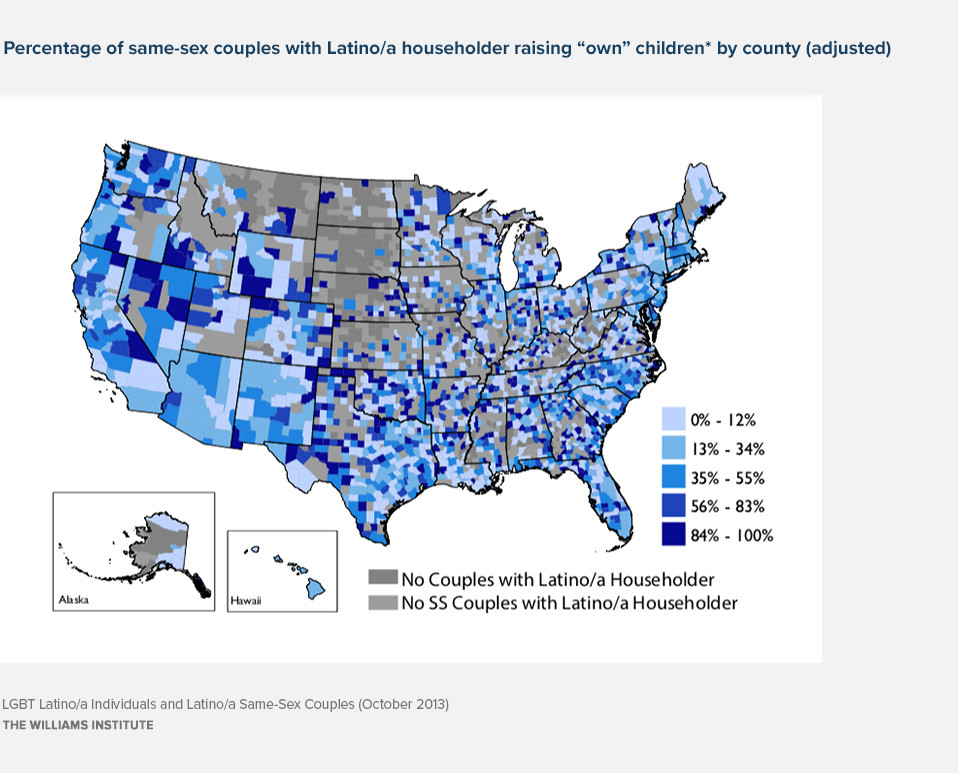
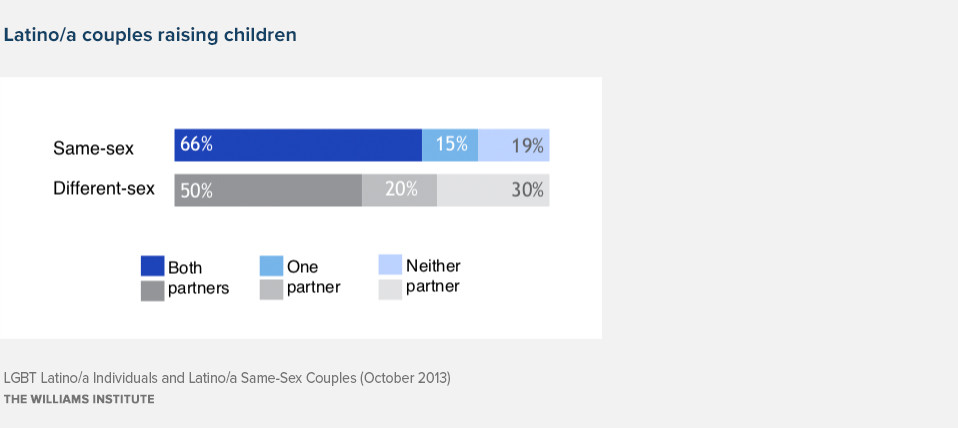
Couples Raising Children
Although 29.1% of same-sex couples with a Latino/a householder are raising children, these couples are not concentrated in major metropolitan areas. The map on the left indicates that Latino/a same-sex couples raising children are scattered throughout counties across the nation.
Geography
LGBT Latino/a adults tend to live in areas where there are higher proportions of Latinos/as, as opposed to areas with higher proportions of the broader LGBT population. This is evident by the inclusion of several Southwestern states on our top ten lists which tend to be areas known for Latino/a residency, but not LGBT residency. States on the East Coast such as Florida, New Jersey, and New York are also included. Notably, within the counties listed, the percent of Latino/a same-sex couples raising children ranges from 9% to 56%.
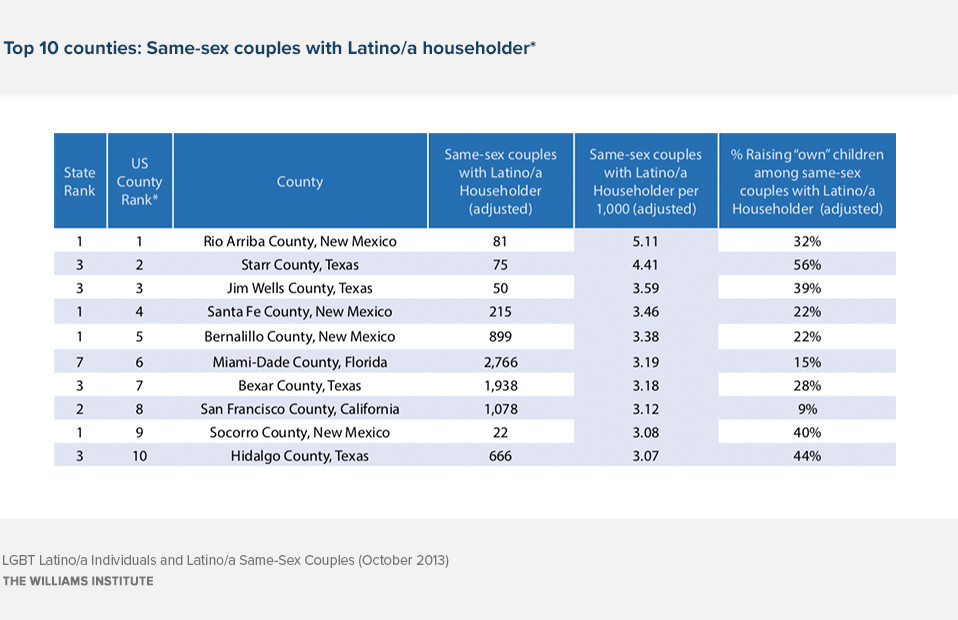
*Including only those counties with 20+ same-sex couples with a Latino/a householder
Characteristics of Latino/a Individuals
The unit of analysis in this section is the individual. We use Gallup Daily tracking survey data to report on characteristics for those that self-identify as LGBT (both single and coupled). We use ACS data to report on the characteristics of individuals in couples. We highlight several characteristics in the charts below, with the additional information listed in Appendix B.
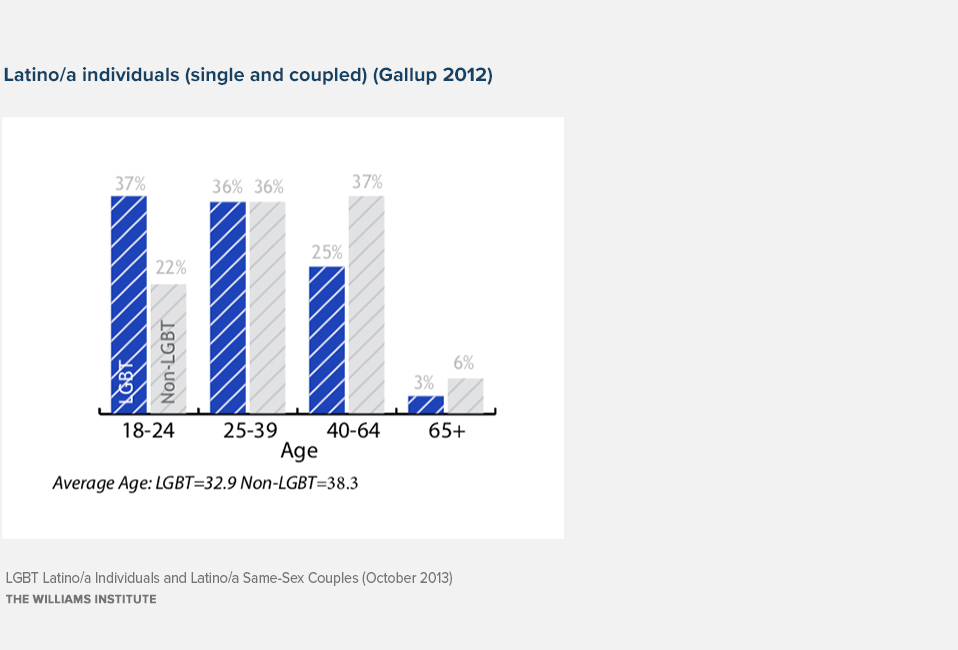
Age Distribution
Direct comparisons between individuals in same-sex couples and all LGBT individuals must be made with caution, as the age distribution of LGBT individuals in the Gallup survey differs from that of Latino/a individuals in same-sex couples identified in the ACS. LGBT Latino/a individuals are much younger than both the non-LGBT Latino/a population and Latinos/as in same-sex couples. These differences in age could help to explain patterns in other demographic characteristics that can be affected by age like education and employment.
Completed a College Degree or More
Latino/a individuals who identify as LGBT in the Gallup survey report similar rates of college completion when compared to Latino/a non-LGBT adults (15%). Latino/a individuals in same-sex couples have higher rates of educational attainment than their different-sex counterparts (26% vs. 14%). The different results could be in part because LGBT Latino/a individuals in the Gallup survey are much younger than their coupled counterparts in the ACS data.
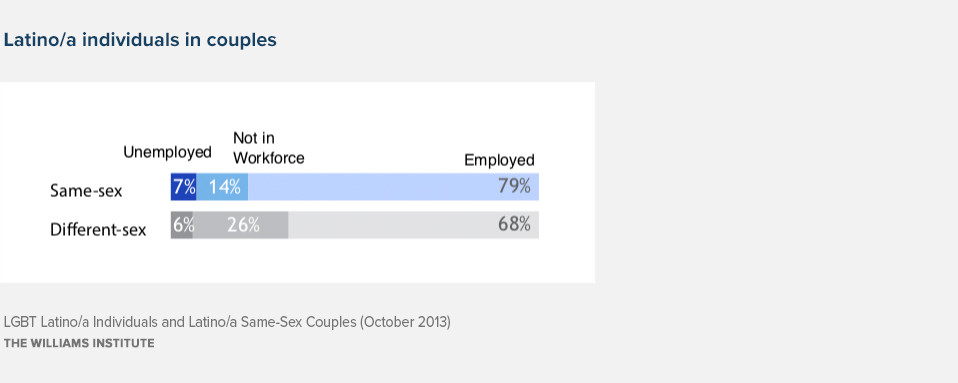
Employment Status
Unemployment rates are higher for Latino/a individuals who identify as LGBT compared to non-LGBT individuals (14% vs. 11%). Latino/a individuals in same-sex couples are more likely to be employed than their counterparts in different-sex couples (79% vs. 68%). LGBT Latinos/as and Latinos/as in same-sex couples are both more likely than their non-LGBT and different-sex counterparts to be in the workforce.
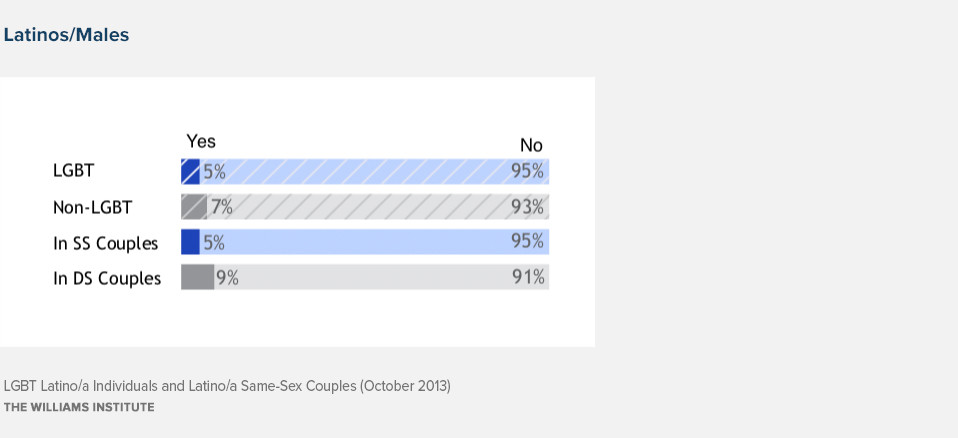
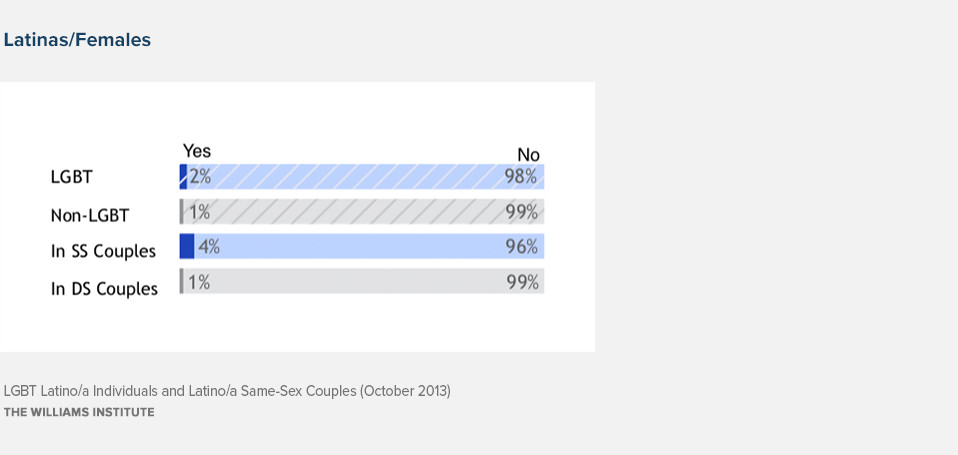
Military Status
In general, men are much more likely than women to serve in the military. LGBT Latinos/men, both individuals and those in same-sex couples, are less likely than comparable non-LGBT Latinos/men to report military service. LGBT Latinas/women, both individuals and those in same-sex couples, are more likely to report military service than comparable non-LGBT women. Notably, Latinas/women in same-sex couples are four times more likely to enter the military than their different-sex counterparts (4% vs. 1%).
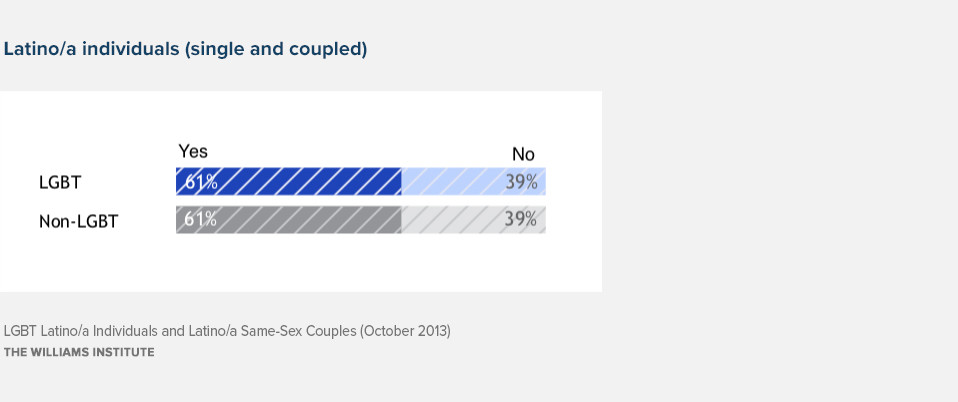
Covered by Health Insurance
The Gallup survey indicates that 61% of both Latino/a LGBT and non-LGBT individuals are covered by health insurance. The proportion of Latino/a individuals covered by health insurance is higher for those in same-sex couples than those in different-sex couples (71% vs. 66%).
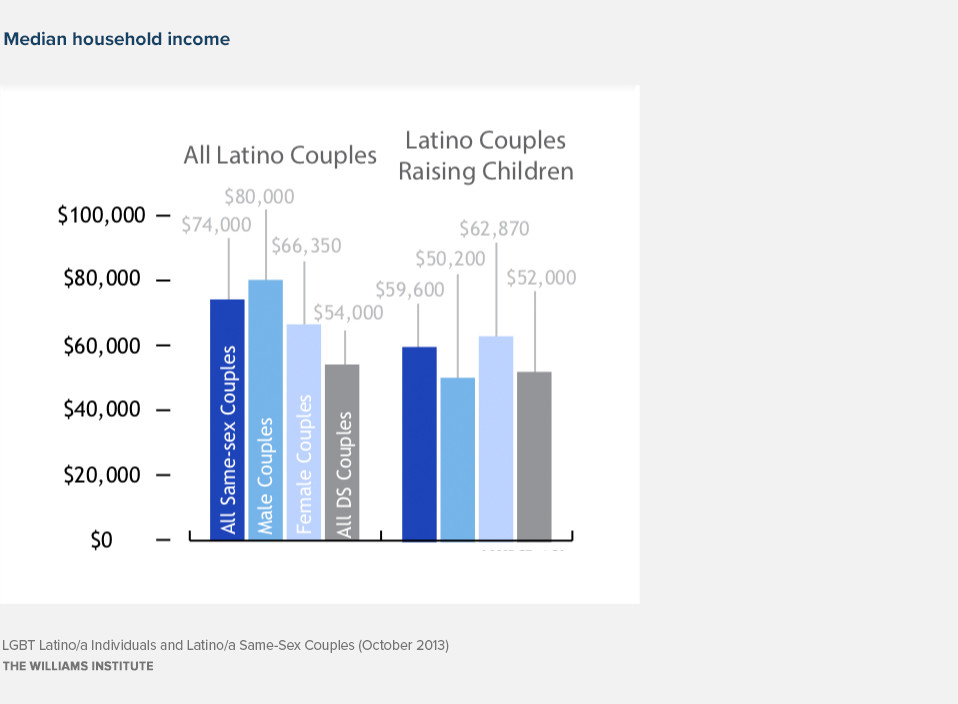
Median Household Income
Latino/a same-sex couples report a higher average household income than different-sex couples ($74,000 vs. $54,000). However, gender matters. Female same-sex couples report a median household income almost $15,000 less than male same-sex couples ($66,350 vs. $80,000). Notably, the gap in reported income by couple-type shrinks when focusing on couples raising children, while the gap by gender seems to reverse.
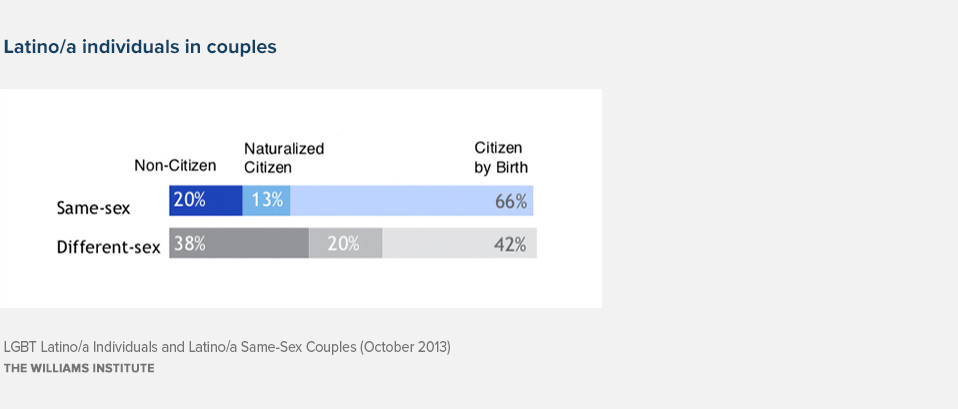
Citizenship Status
Overall, Latino/a individuals in same-sex couples are more likely to be citizens by birth than those in different-sex couples (66% vs. 42%). A difference in reported citizenship status between individuals in same-sex couples and different-sex couples can affect proportions of characteristics that may largely depend on citizenship, such as health insurance coverage and income. We cannot provide comparable data for LGBT individuals from the Gallup survey, as they do not include a question regarding citizenship status.
Characteristics of Latino/a Couples
In this section of the report, the unit of analysis is the couple. Using the couple as the unit of analysis allows us to view the household as a whole. Below, we present information for both same-sex and different-sex Latino/a couples, indicating whether both, one or neither partner has the attribute in question. We also highlight the characteristics of those couples that are raising children.
Completed a College Degree or More
Almost half of all Latino/a same-sex couples (48%) include at least one partner with a college degree or more, compared to 24% of different-sex couples. However, the percent of same-sex couples that include two college graduates drops from 19% to 10% when focusing on couples raising children.

Latino/a same-sex couples report a higher average household income than different-sex couples ($74,000 vs. $54,000). However, gender matters. Female same-sex couples report a median household income almost $15,000 less than male same-sex couples ($66,350 vs. $80,000). Notably, the gap in reported income by couple-type shrinks when focusing on couples raising children, while the gap by gender seems to reverse.
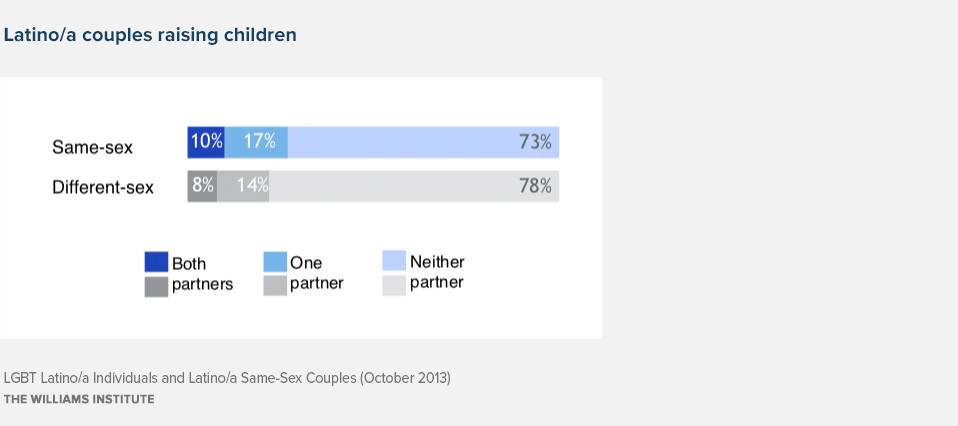
Covered by Health Insurance
Latino/a same-sex couples are more likely to have health insurance coverage for one or both partners than different-sex couples (85% vs. 76%). However, the gap between same-sex and different-sex couples shrinks when looking only at couples raising children (73% vs. 71%).
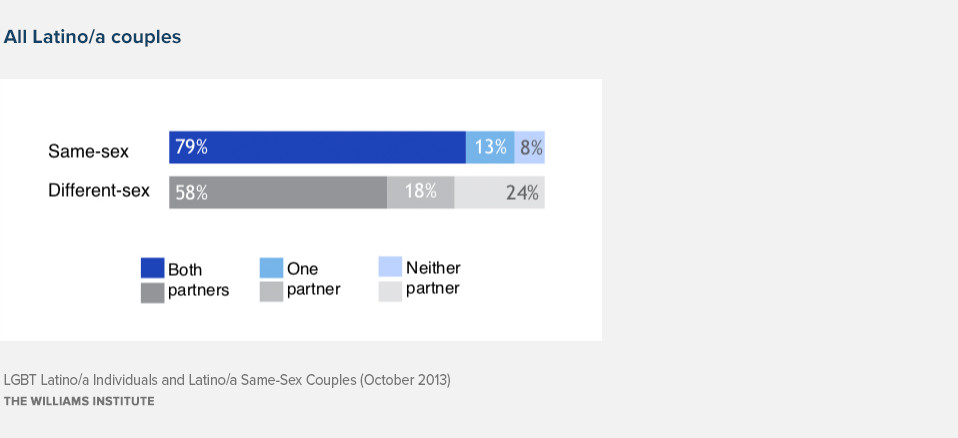
Citizenship Status
Overall, Latino/a same-sex couples are more likely than Latino/a different-sex couples to have at least one partner with U.S. citizenship status, whether by birth or naturalization (92% vs. 76%). About 1 in 5 Latino/a same-sex couples have at least one partner who reported non-citizen status. For Latino/a same-sex couples raising children, 1 in 3 couples include at least one non-citizen partner.
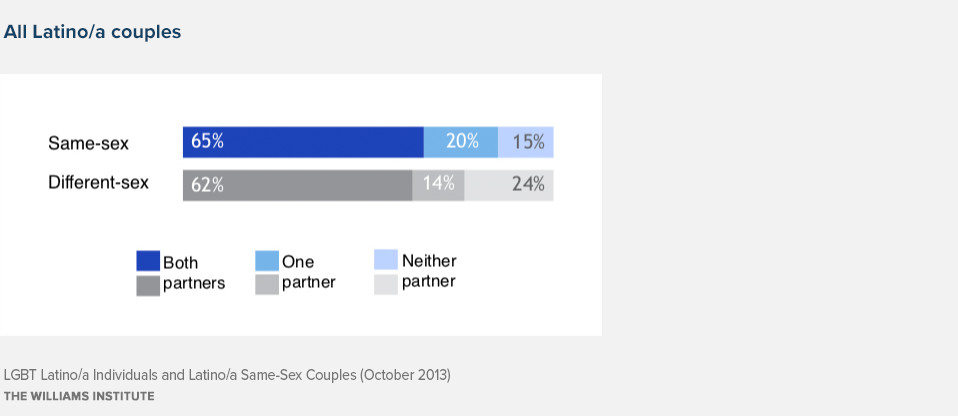
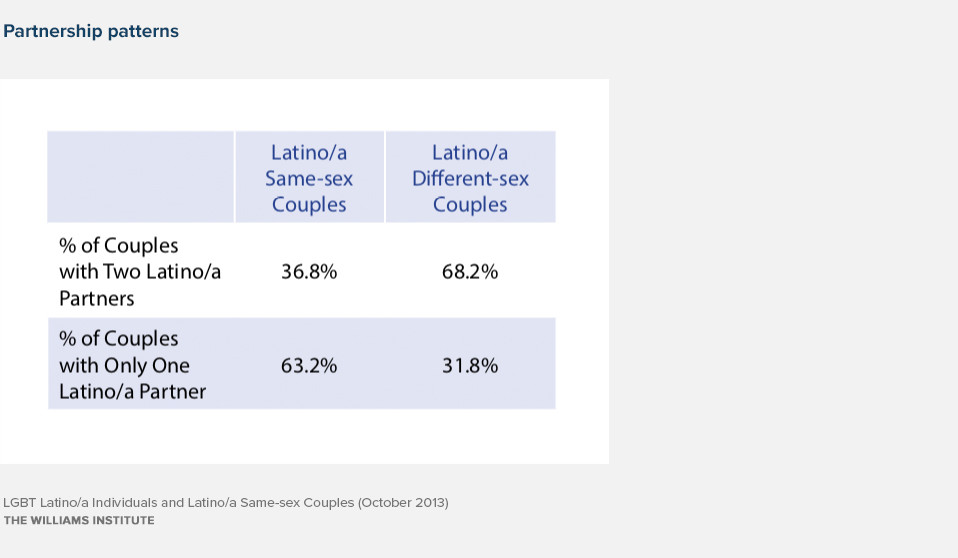
Partnership Patterns
In 63% of same-sex couples with a Latino/a partner, the other partner is not Latino/a. This is the case for only 32% of different-sex couples. Same-sex couples with only one Latino/a partner report a higher median household income compared to different-sex couples with one Latino/a partner ($85,000 vs. $75,000). This pattern is also true for same-sex couples with two Latino/a partners, however, the reported median household incomes are lower overall ($55,000 vs. $46,300). Notably, both same-sex and different-sex couples with two Latino/a partners are less likely to have both partners complete a college degree than their counterparts with one Latino/a partner.
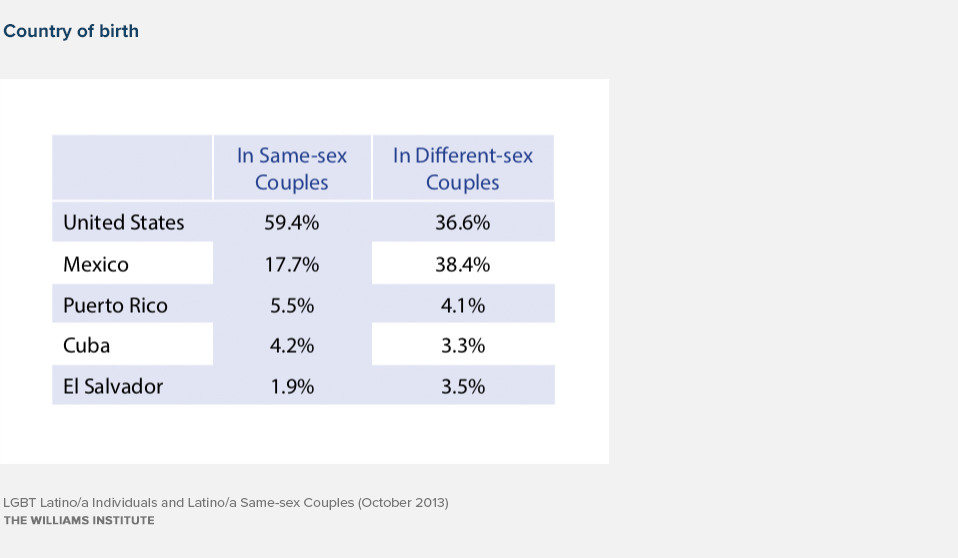
Country of Birth
Latino/a individuals in same-sex couples are much more likely to be born in the United States than Latino/a individuals in different-sex couples (59% vs. 36%). Within those born outside of the U.S., the highest proportion of Latinos/as in same-sex couples are born in Mexico. Notably, Latinos/as in different-sex couples are about twice as likely to report being born in Mexico than Latino/a individuals in same-sex couples. Puerto Rico, Cuba and El Salvador round out the top five list of countries of origin.
Completed a College Degree or More
College completion rates are often used as a measure of economic well-being. In order to highlight differences in socioeconomic characteristics among subpopulations within the Latino/a community, we include college completion rates by ancestry for individuals in same-sex couples and individuals in different-sex couples. We only include data for Latino/a subpopulations where the number of respondents in same-sex couples was high enough to provide accurate data.
Regardless of ancestry, Latino/a individuals in same-sex couples tend to complete a college degree at higher rates than comparable individuals in different-sex couples. However, rates of college completion vary depending on individual ancestry. Individuals of Spanish or Cuban ancestry report high levels of educational attainment, while Mexican, Salvadoran, and Puerto Rican individuals report lower rates of college completion.

Conclusion
Overall, Latino/a individuals in same-sex couples are faring better than their different-sex counterparts. They are more likely to be employed, more likely to have health insurance and more likely to have completed a college degree. The gender of the couple and whether a couple is raising children makes a difference. For example, Latino/a same-sex couples raising children fare closer to comparable different-sex couples in educational attainment, annual income, and health insurance coverage. Notably, while Latino/a individuals in same-sex couples overall are more likely to be born in the U.S., Latino/a same-sex couples raising children are more likely to have two non-citizen partners compared to Latino/a same-sex couples without children. This may have an affect on characteristics such as annual income and health insurance coverage.
Download the brief