Executive Summary
In the United States, little information is available about the number or characteristics of lesbian, gay, bisexual, and transgender (LGBT) immigrants. Using data from the Pew Research Center, the 2017 Gallup Daily Tracking survey, and the U.S. Census Bureau’s American Community Survey, this report estimates the number of LGBT-identified undocumented and documented adult immigrants and foreign-born residents who are part of a same-sex couple. It also describes some of their demographic characteristics. This report updates a 2013 Williams Institute report.
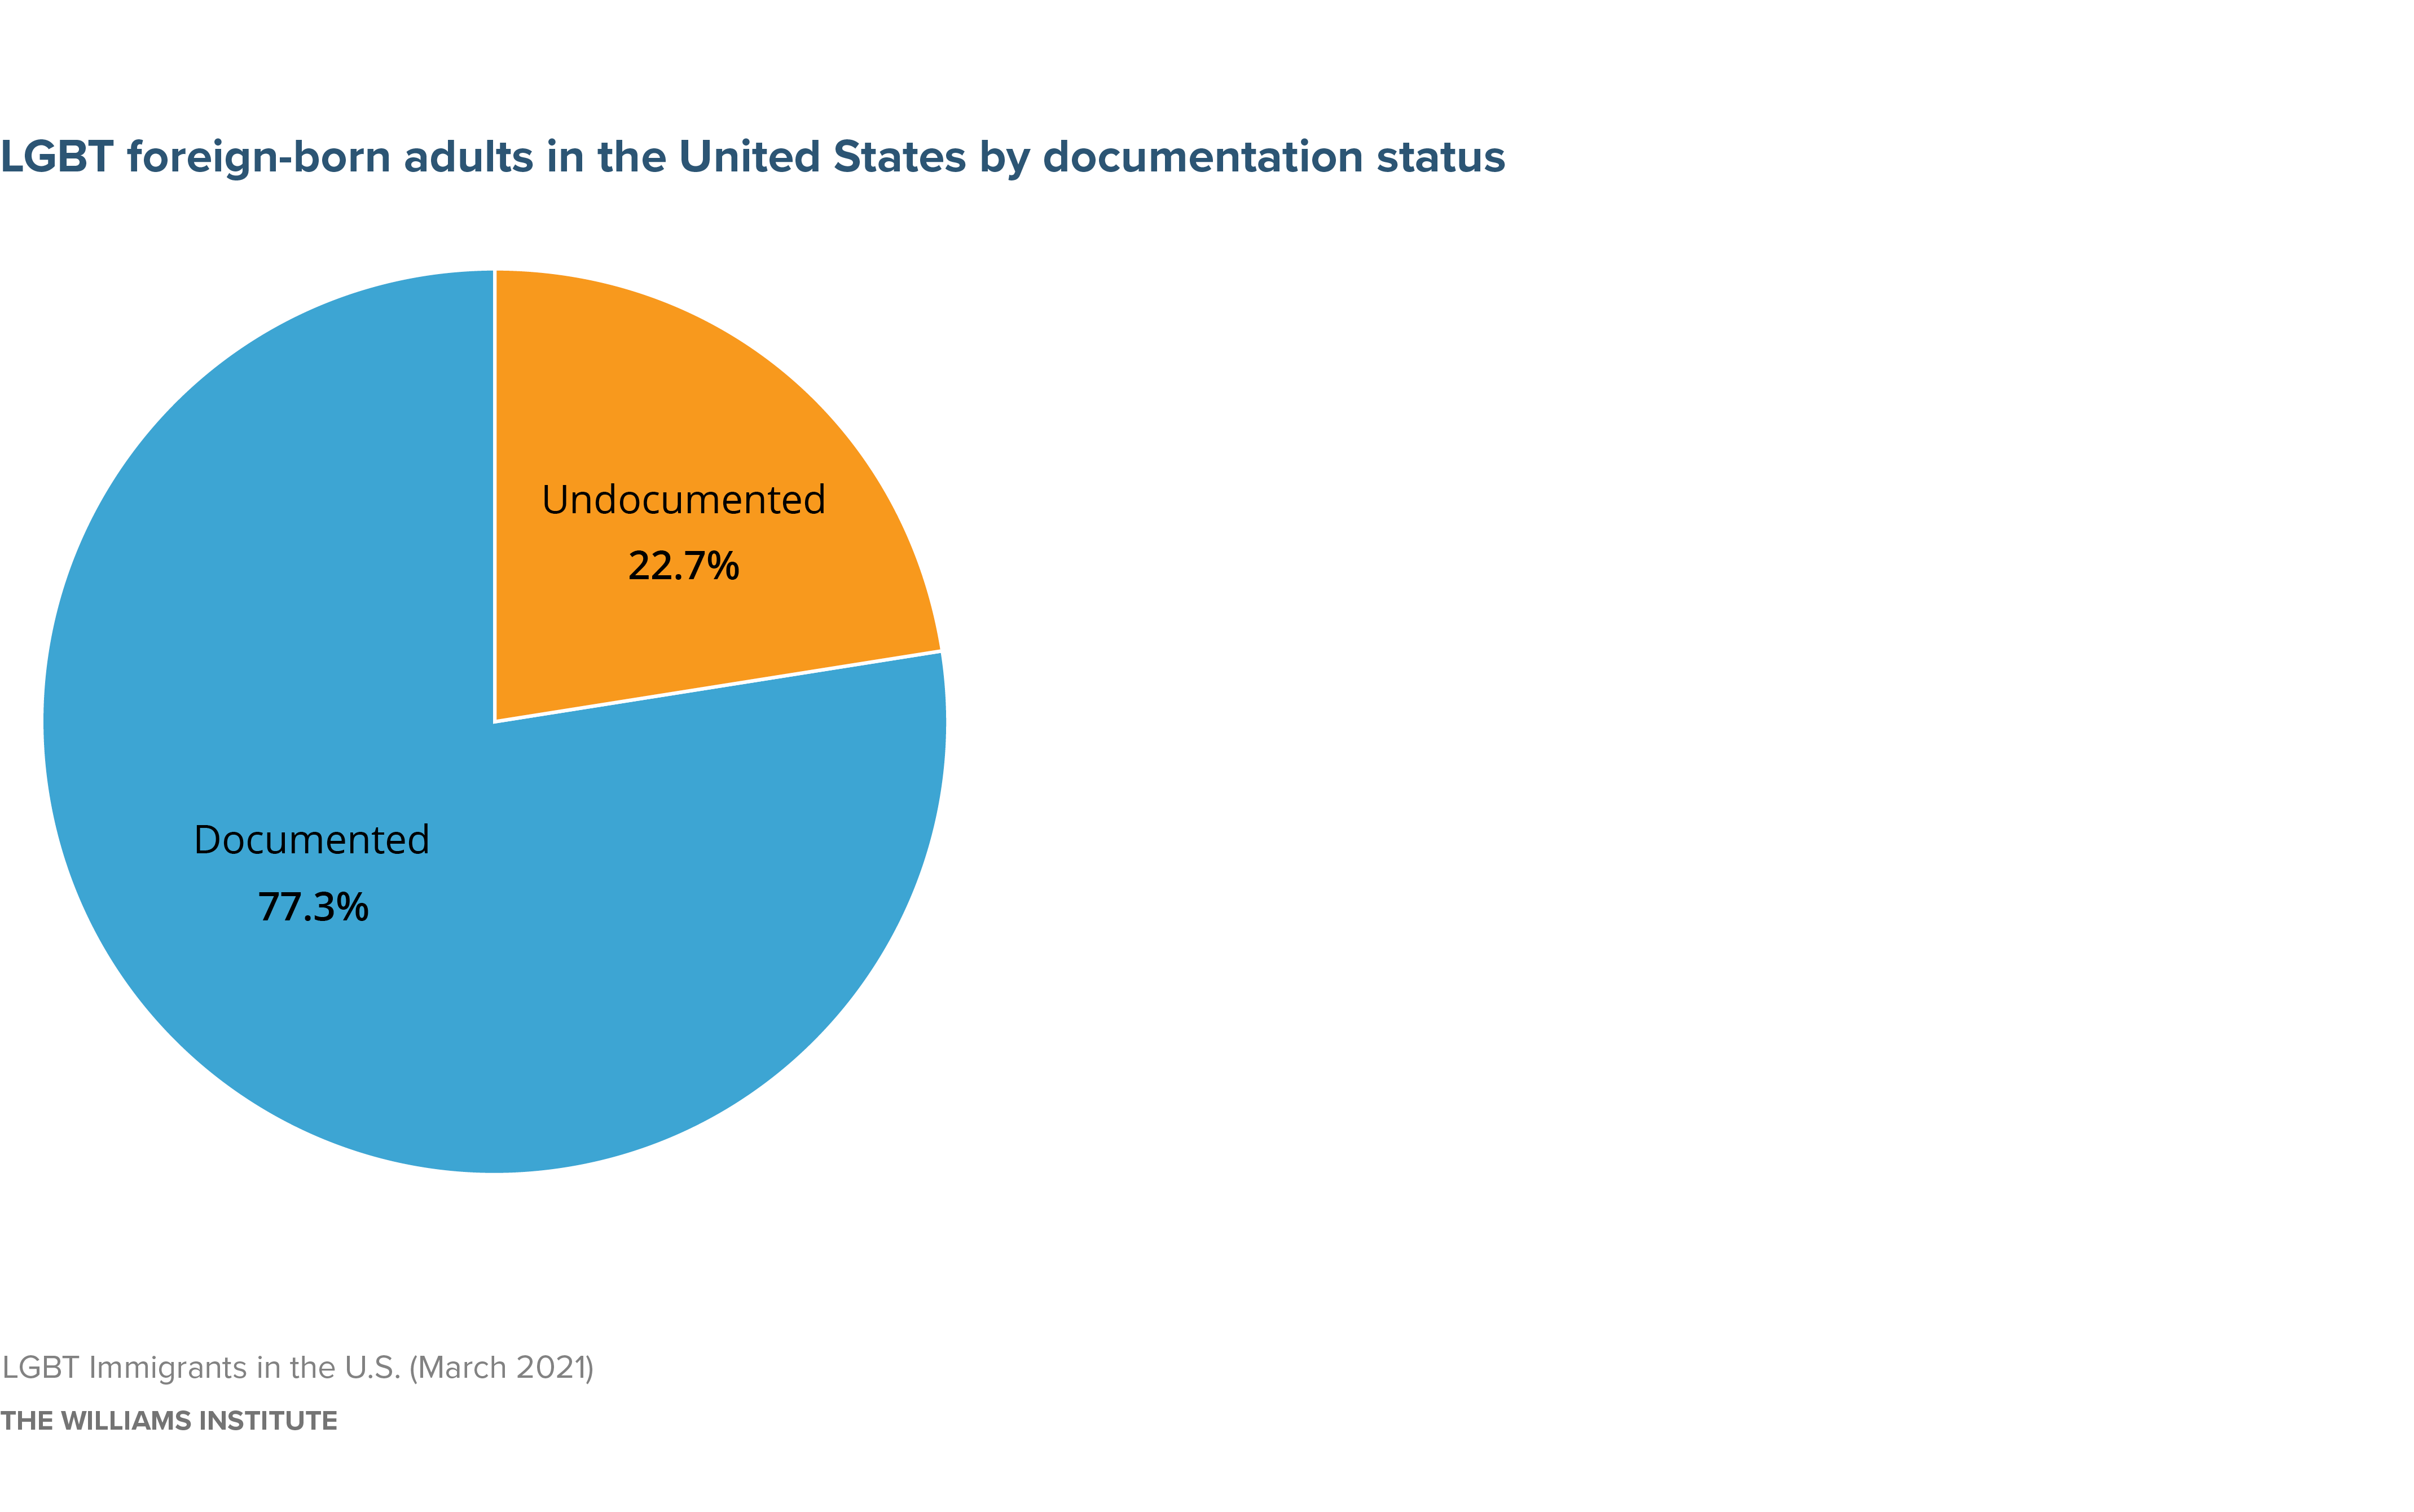
Overall, there are an estimated 1,274,500 LGBT foreign-born adults in the U.S., including 289,700 (22.7%) who are undocumented and 984,800 (77.3%) who are documented.
In the U.S., about 128,500 same-sex couples include at least one foreign-born partner/spouse. Approximately 94,400 of these couples are binational, meaning that one partner/spouse is a native-born U.S. citizen and the other is either a naturalized citizen or a non-citizen.
Key Findings: Undocumented LGBT Adult Immigrants
- There are an estimated 289,700 LGBT-identified individuals among the adult undocumented immigrant population, representing approximately 3.0% of undocumented adults in the U.S.
- Relative to all undocumented immigrants, LGBT undocumented immigrants are more often male and are younger.
- Almost half (48.3%) of LGBT undocumented immigrants are between the ages of 18 and 29, compared with about a fifth of undocumented immigrants overall (21.9%).
- 61.8% of LGBT undocumented immigrants are male compared to 54.0% of adult undocumented immigrants and 42.2% of all LGBT adults in the U.S.
- Three quarters (75.7%) of undocumented LGBT adults are Latino/a—similar to the percentage of all undocumented adults (73.3%).
- An estimated 209,500 undocumented LGBT adults were born in 10 Latin American countries, including 136,600 from Mexico and 48,300 from the Northern Triangle (El Salvador, Guatemala, Honduras).
- More than one in ten (13.6%) undocumented LGBT adults are Asian or Pacific Islander— similar to the percentage of all undocumented adults (14.0%).
- An estimated 35,500 undocumented LGBT adults are from five countries in Asia: India, China, the Philippines, Korea, and Vietnam.
- State-level estimates suggest that 59,600 undocumented LGBT adults live in California, 43,300 in Texas, 21,000 in Florida, 19,600 in New York, and 12,900 in New Jersey.
Key Findings: Documented LGBT Adult Immigrants
- There are an estimated 984,800 LGBT-identified individuals among the adult documented immigrant population, representing approximately 3.0% of documented adults in the U.S.
- Like their undocumented counterparts, LGBT documented immigrants are more often male and are younger compared to all documented adults—54.5% of LGBT documented immigrants are male (versus 46.6% documented immigrants overall), and 39.9% are between the ages of 18 and 29 (versus 13.4% of documented immigrants overall).
- 39.0% of documented LGBT adults are Latino/a—similar to the percentage of all documented adults (36.2%).
- 31.9% of documented LGBT adults are Asian or Pacific Islander—similar to the percentage of all undocumented adults (31.2%).
Key Findings: Same-Sex Couples with a Foreign-Born Spouse or Partner
- There are an estimated 169,400 foreign-born individuals (naturalized citizens and non-citizens) who are part of a same-sex couple. An estimated 86,500 (51.0%) are naturalized citizens, while 82,900 (49.0%) of these individuals are not U.S. citizens.
- An estimated 128,500 same-sex couples include at least one foreign-born partner/spouse. Approximately 94,400 of these couples are binational, meaning that one partner/spouse is a native-born U.S. citizen and the other is either a naturalized citizen or a non-citizen.
- An estimated 18,200 same-sex couples with at least one foreign-born partner/spouse are raising an estimated 31,000 children under the age of 18.
- Dual non-citizens and dual naturalized citizen same-sex couples are the most likely to be raising children under age 18 (23.6% and 21.2%, respectively).
Read the report