Executive Summary
This report uses four large, national, population-based surveys to consider the ways in which LGBT populations are demographically similar to or distinct from their non-LGBT counterparts in the United States.
The surveys analyzed include:
- National Survey of Family Growth, 2006-2010 (NSFG)
- General Social Survey, 2008, 2010, 2012 (GSS)
- National Health Interview Survey, 2013 (NHIS)
- Gallup Daily Tracking Survey, 2014.
Comparisons of demographic characteristics are made among the surveys and, when possible, among sexual orientation identities to consider differences between those who identify as lesbian or gay and those who identify as bisexual. The term “LGB/T” is used to refer to respondents among the surveys since only one of the surveys explicitly included transgender within the LGBT identification question.
Despite variations across the surveys related to the time period in which data were collected, data collection modes, and the wordings of LGB/T identity questions, findings suggest many consistencies across data sources in demographic characteristics of LGB/T identified adults in comparison to their non-LGB/T counterparts. These consistencies persist even among surveys where estimates of the prevalence of LGB/T identified adults vary.
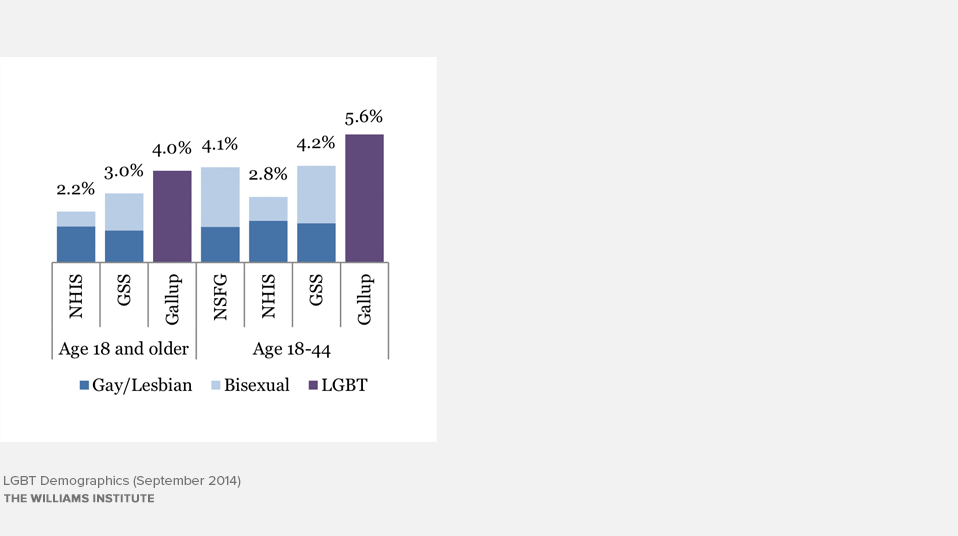
The proportion of adults who identified as LGB/T varied across the surveys from 2.2% in the NHIS to 4.0% in the Gallup data. These estimates imply that between 5.2 and 9.5 million adults in the United States identify as LGB/T.
But the actual motivation for measuring LGB/T identity on these surveys is less about a prevalence estimate and more about the ability to compare and contrast characteristics of LGB/T individuals with their non-LGB/T counterparts. The relative consistency of the characteristics of LGB/T samples across these surveys suggests that, while surveys may vary in the proportion of adults who are willing to identify as LGB/T in the survey, those who choose to identify are similar across surveys.
This increases confidence that differences or similarities observed between LGB/T identified and non-LGB/T identified adults are actually present in the population and not simply the result of a particular survey methodology or sample. Examples of consistent findings include:
- LGB/T identity is more common among younger populations.
- LGB/T populations generally share the racial and ethnic characteristics of non-LGB/T individuals.
- Adults are more likely to identify as LGB/T in the Northeast and West than in the South and Midwest.
The finding of higher levels of LGB/T identity among younger populations. This may be, at least in part, a result of increased levels of social acceptance experienced throughout the lives of younger LGB/T individuals when compared to their older counterparts. If this were true, then demographic distinctions between LGB/T and non-LGB/T populations, like differences observed in educational attainment, may become less apparent over time as a wider demographic cross-section of the population is willing to identify as LGB/T.
Download the full report
