Many Americans worry about the high cost of prescription medications. A recent poll by the Kaiser Foundation found that about 60% of Americans report taking at least one prescription medication and that 80% of all Americans feel that the current cost of prescription drugs is unreasonable. There is currently broad public support for addressing this issue, which is likely to be a focus in the next session of Congress. This brief provides a snapshot of Californians’ access to prescription medications among LGBTQ and cisgender and straight/heterosexual adults.
Data from the California Health Interview Survey indicate that LGBT people (5.6% of respondents) are more likely to delay getting the prescription medications they need or to go with them entirely. This is particularly true for more vulnerable parts of the LGBT population, including bisexuals, transgender people, lesbians, those with low incomes, and the elderly.
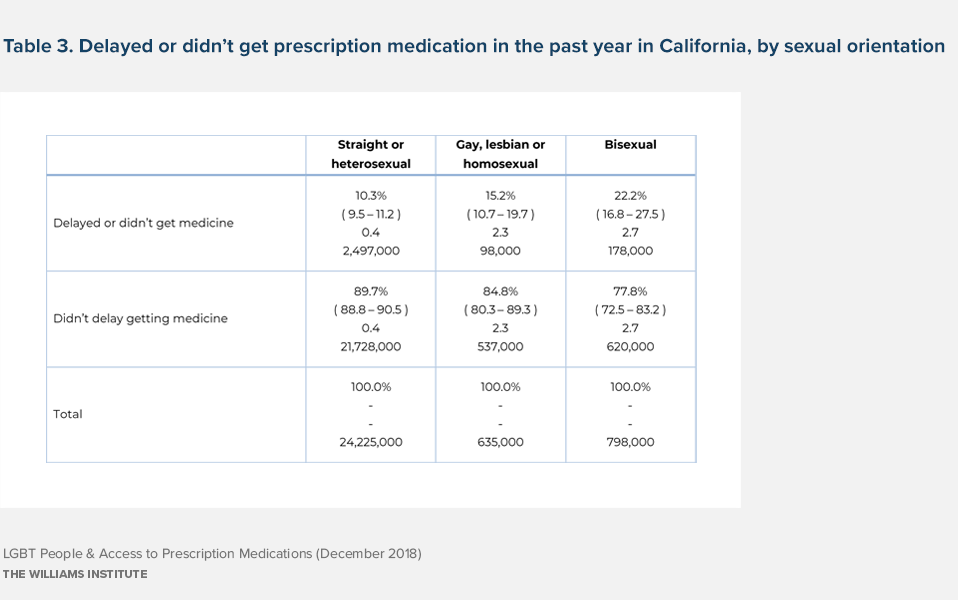
While 10% of straight people in California reported delaying or going without the prescription medicines they needed in the past 12 months, that percentage was higher for gay men and lesbians (15%)—and more than double for bisexuals (22%). (Table 3)
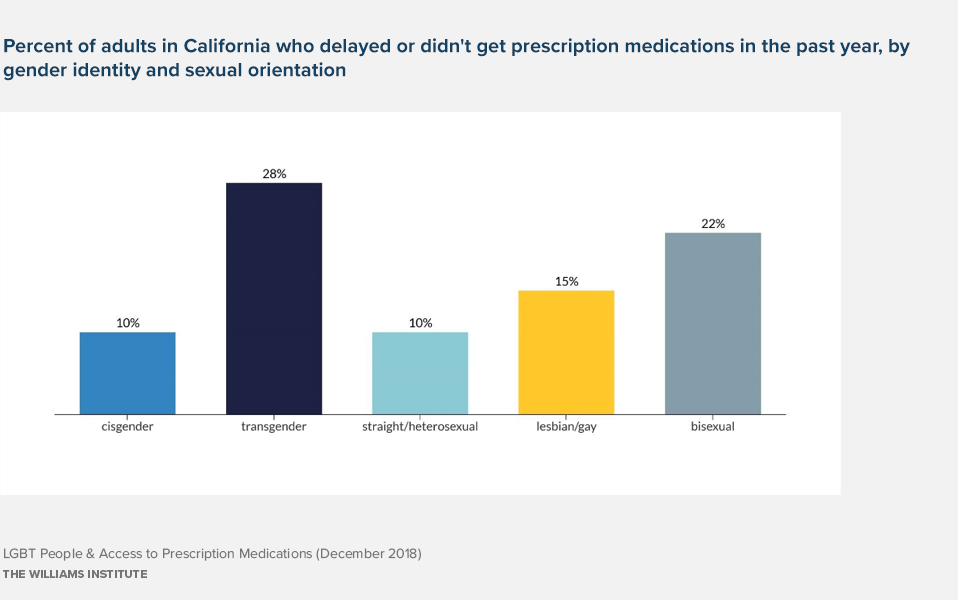
Data Source: Williams Institute analysis of California Health Interview Survey, 2015-2017
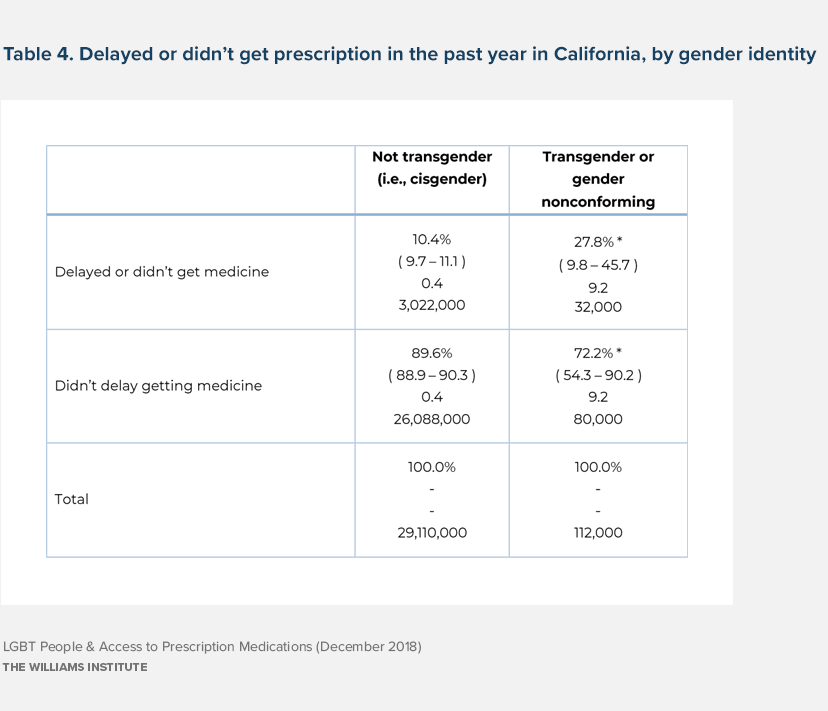
The difference in delaying or going without prescription medications was even greater between cisgender people and transgender people. Although this difference was not statistically significantly different due to the small number of transgender people in the dataset (Table 2), it is consistent with what we know about health disparities for transgender people in general. In fact, given the large percentage of transgender people who are poor and unstably housed—and therefore less likely to have been reached by CHIS—there is reason to believe the actual difference in prescription medication access may be even greater.
CHIS also asks why respondents delayed or went without medical care in general (not just prescription medicines). Gays, lesbians, and bisexuals were slightly more likely to report the main reason as “cost, lack of insurance, and other insurance reasons.”
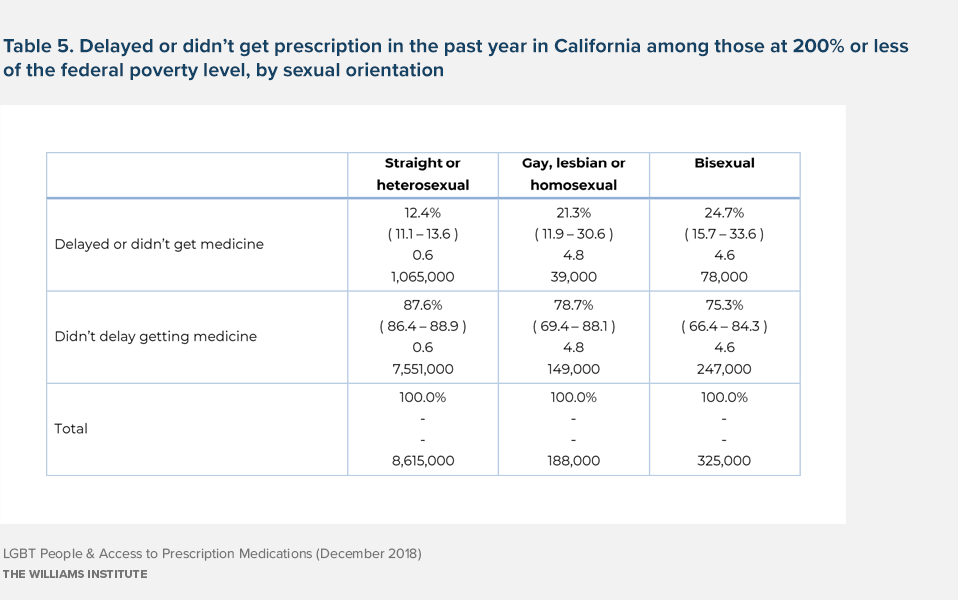
Williams Institute research has consistently documented that LGBT people are more likely to live in poverty. Among Californians who are below 200% of the Federal Poverty Level, 12% of straight people reported that they delayed or went without prescription medicines in the past year, compared with 21% of gay and lesbian CHIS respondents and 25% of bisexual respondents. (Table 4)
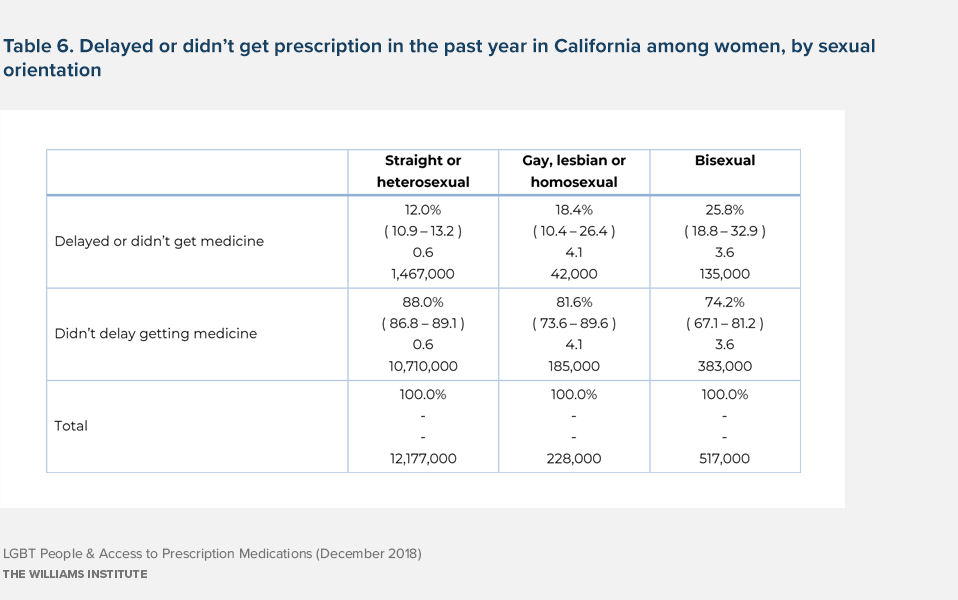
CHIS data also show that sexual minority women face more barriers to accessing prescription medications than men. (Table 6 and 7). Twelve percent of straight or heterosexual women in California delayed or went without prescription medications in the past year, compared with 18% of lesbians and 26% of bisexual women. These rates were lower for men of sexual orientations: 9% of straight or heterosexual men delayed or went without prescription medications in the past year, compared with 13% of gay men and 16% of bisexual men. This is not surprising because more women, in general, live in poverty or have low incomes. Within the LGB community, a 2018 Williams Institute report that found sexual minority women, in particular, were more likely to have low incomes than heterosexual women.
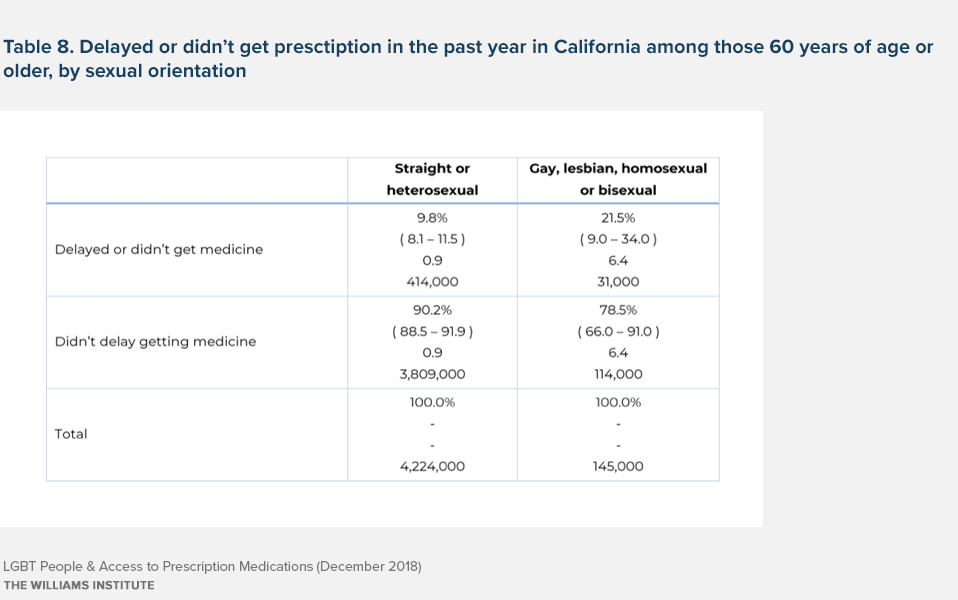
Prior Williams Institute research shows these differences may also disproportionately impact older LGBTQ Californians, who are more likely to be on one or more prescription medications. Based on CHIS data from 2015-2017, 10% of straight Californians aged 60 or over reported delaying or not getting prescription medication in the past year compared to 22% of older LGB respondents. (Table 8)
These data suggest that LGBT people will be disproportionately impacted by potential reductions in mandated prescription drug coverage and/or potential increases in prescription drug costs.
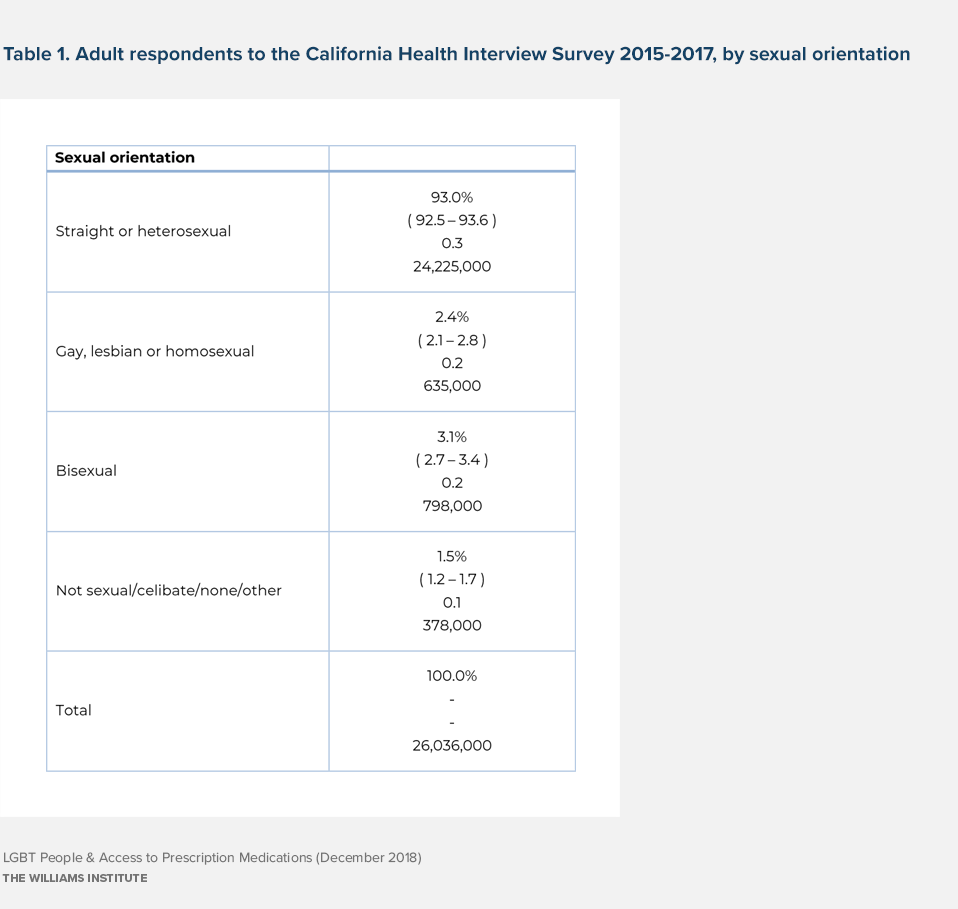
Data Source: 2015-2017 California Health Interview Survey; 95% confidence interval is displayed in the table
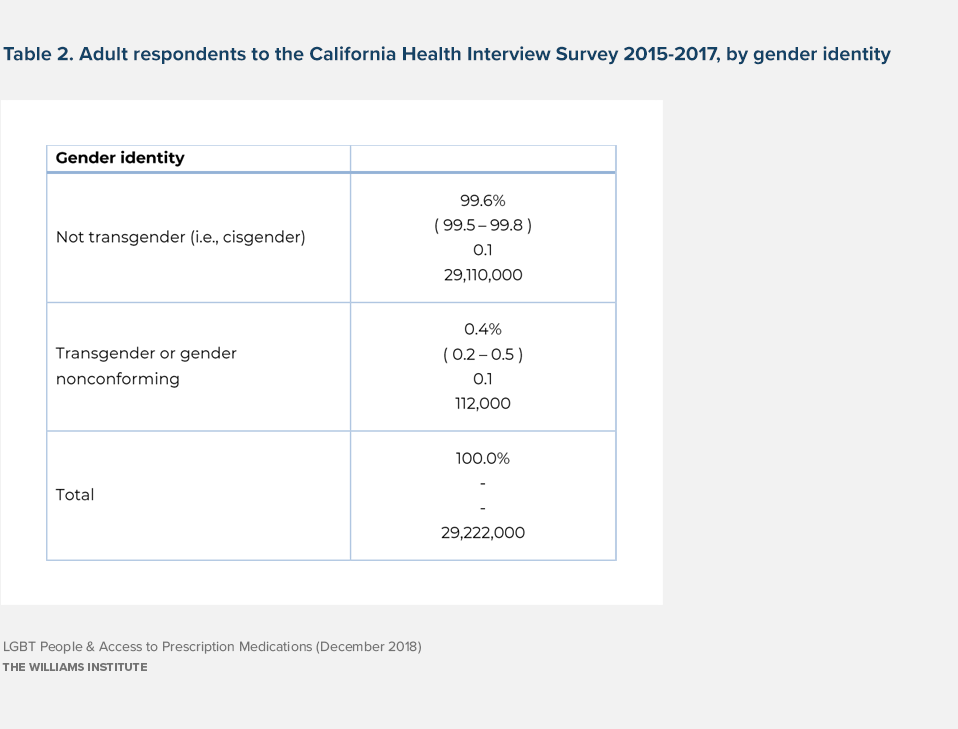
Data Source: 2015-2017 California Health Interview Survey; 95% confidence interval is displayed in the table
Data Source: 2015-2017 California Health Interview Survey; 95% confidence interval is displayed in the table
*Statistically unstable
Data Source: 2015-2017 California Health Interview Survey; 95% confidence interval is displayed in table
Data Source: 2015-2017 California Health Interview Survey; 95% confidence interval is displayed in table
Data Source: 2015-2017 California Health Interview Survey; 95% confidence interval is displayed in table


