Brief

Food Insecurity Among LGBTQ Youth

June 2023

Using data from the Youth Risk Behavior Survey and the U.S. Census Household Pulse Survey, this brief examines experiences of food insecurity among LGBT and non-LGBT high school youth and older youth ages 18-24.

Highlights
One in five LGBT high school students experienced hunger last month due to lack of food at home.
Racial inequities in hunger due to food insecurity exist for both age groups.
Accessing school-based food programs can be difficult for LGBT youth who feel unsafe at school.
Data Points
20%
of LGBT high school students faced hunger last month
14%
of LGBT youth aged 18 to 24 reported not having enough to eat last week
33%
of Black LGBT high school students reported hunger
14%
of their white peers reported hunger
15%
of LGBT youth of color aged 18 to 24 reported food insufficiency
13%
of their white LGBT peers reported food insufficiency
23%
of income-eligible LGBT adult households are enrolled in SNAP
Brief

This brief provides new information about food insecurity among LGBTQ youth. Inadequate access to food has been observed more often among LGBT than non-LGBT adults;1 however, less is known about access to food among youth.

Food insecurity, food insufficiency, and hunger are related experiences that are defined2 as follows:

Food insecurity indicates inadequate or uncertain access to food due to insufficient income or other resources. Prior research shows that food insecurity negatively impacts learning and health.3

Food insufficiency refers to food inadequacies that lead to not having enough to eat. While food insecurity includes worrying about food running out (even if it has not yet run out) and having reduced quality or variety of foods (even if the amount of food is sufficient), food insufficiency is a very low level of food security, that is, when a person does not have enough to eat.4

Hunger refers to a potential consequence of food insufficiency. Hunger is “discomfort, illness, weakness, or pain” caused by “prolonged, involuntary lack of food.” Food insufficiency does not necessarily cause hunger, but hunger is a possible outcome of food insufficiency.

This brief presents new analyses about the experience of self-reported hunger due to insufficient food at home among LGBT and non-LGBT high school youth using data collected on state Youth Risk Behavior Surveys. For LGBT and non-LGBT 18- to 24-year-olds, we use data from the U.S. Census Bureau’s Household Pulse Survey about food insufficiency experienced within the past seven days.

Hunger Among High School Youth

  • One in five (20.1%) LGBT high schoolers in a three-state sample experienced hunger in the last 30 days because there was not enough food at home. In comparison, 15.7% of their non-LGBT peers experienced hunger because there was not enough food at home.5
  • Nationally, an estimated 371,000 LGBT high school students experience hunger due to food insecurity.6
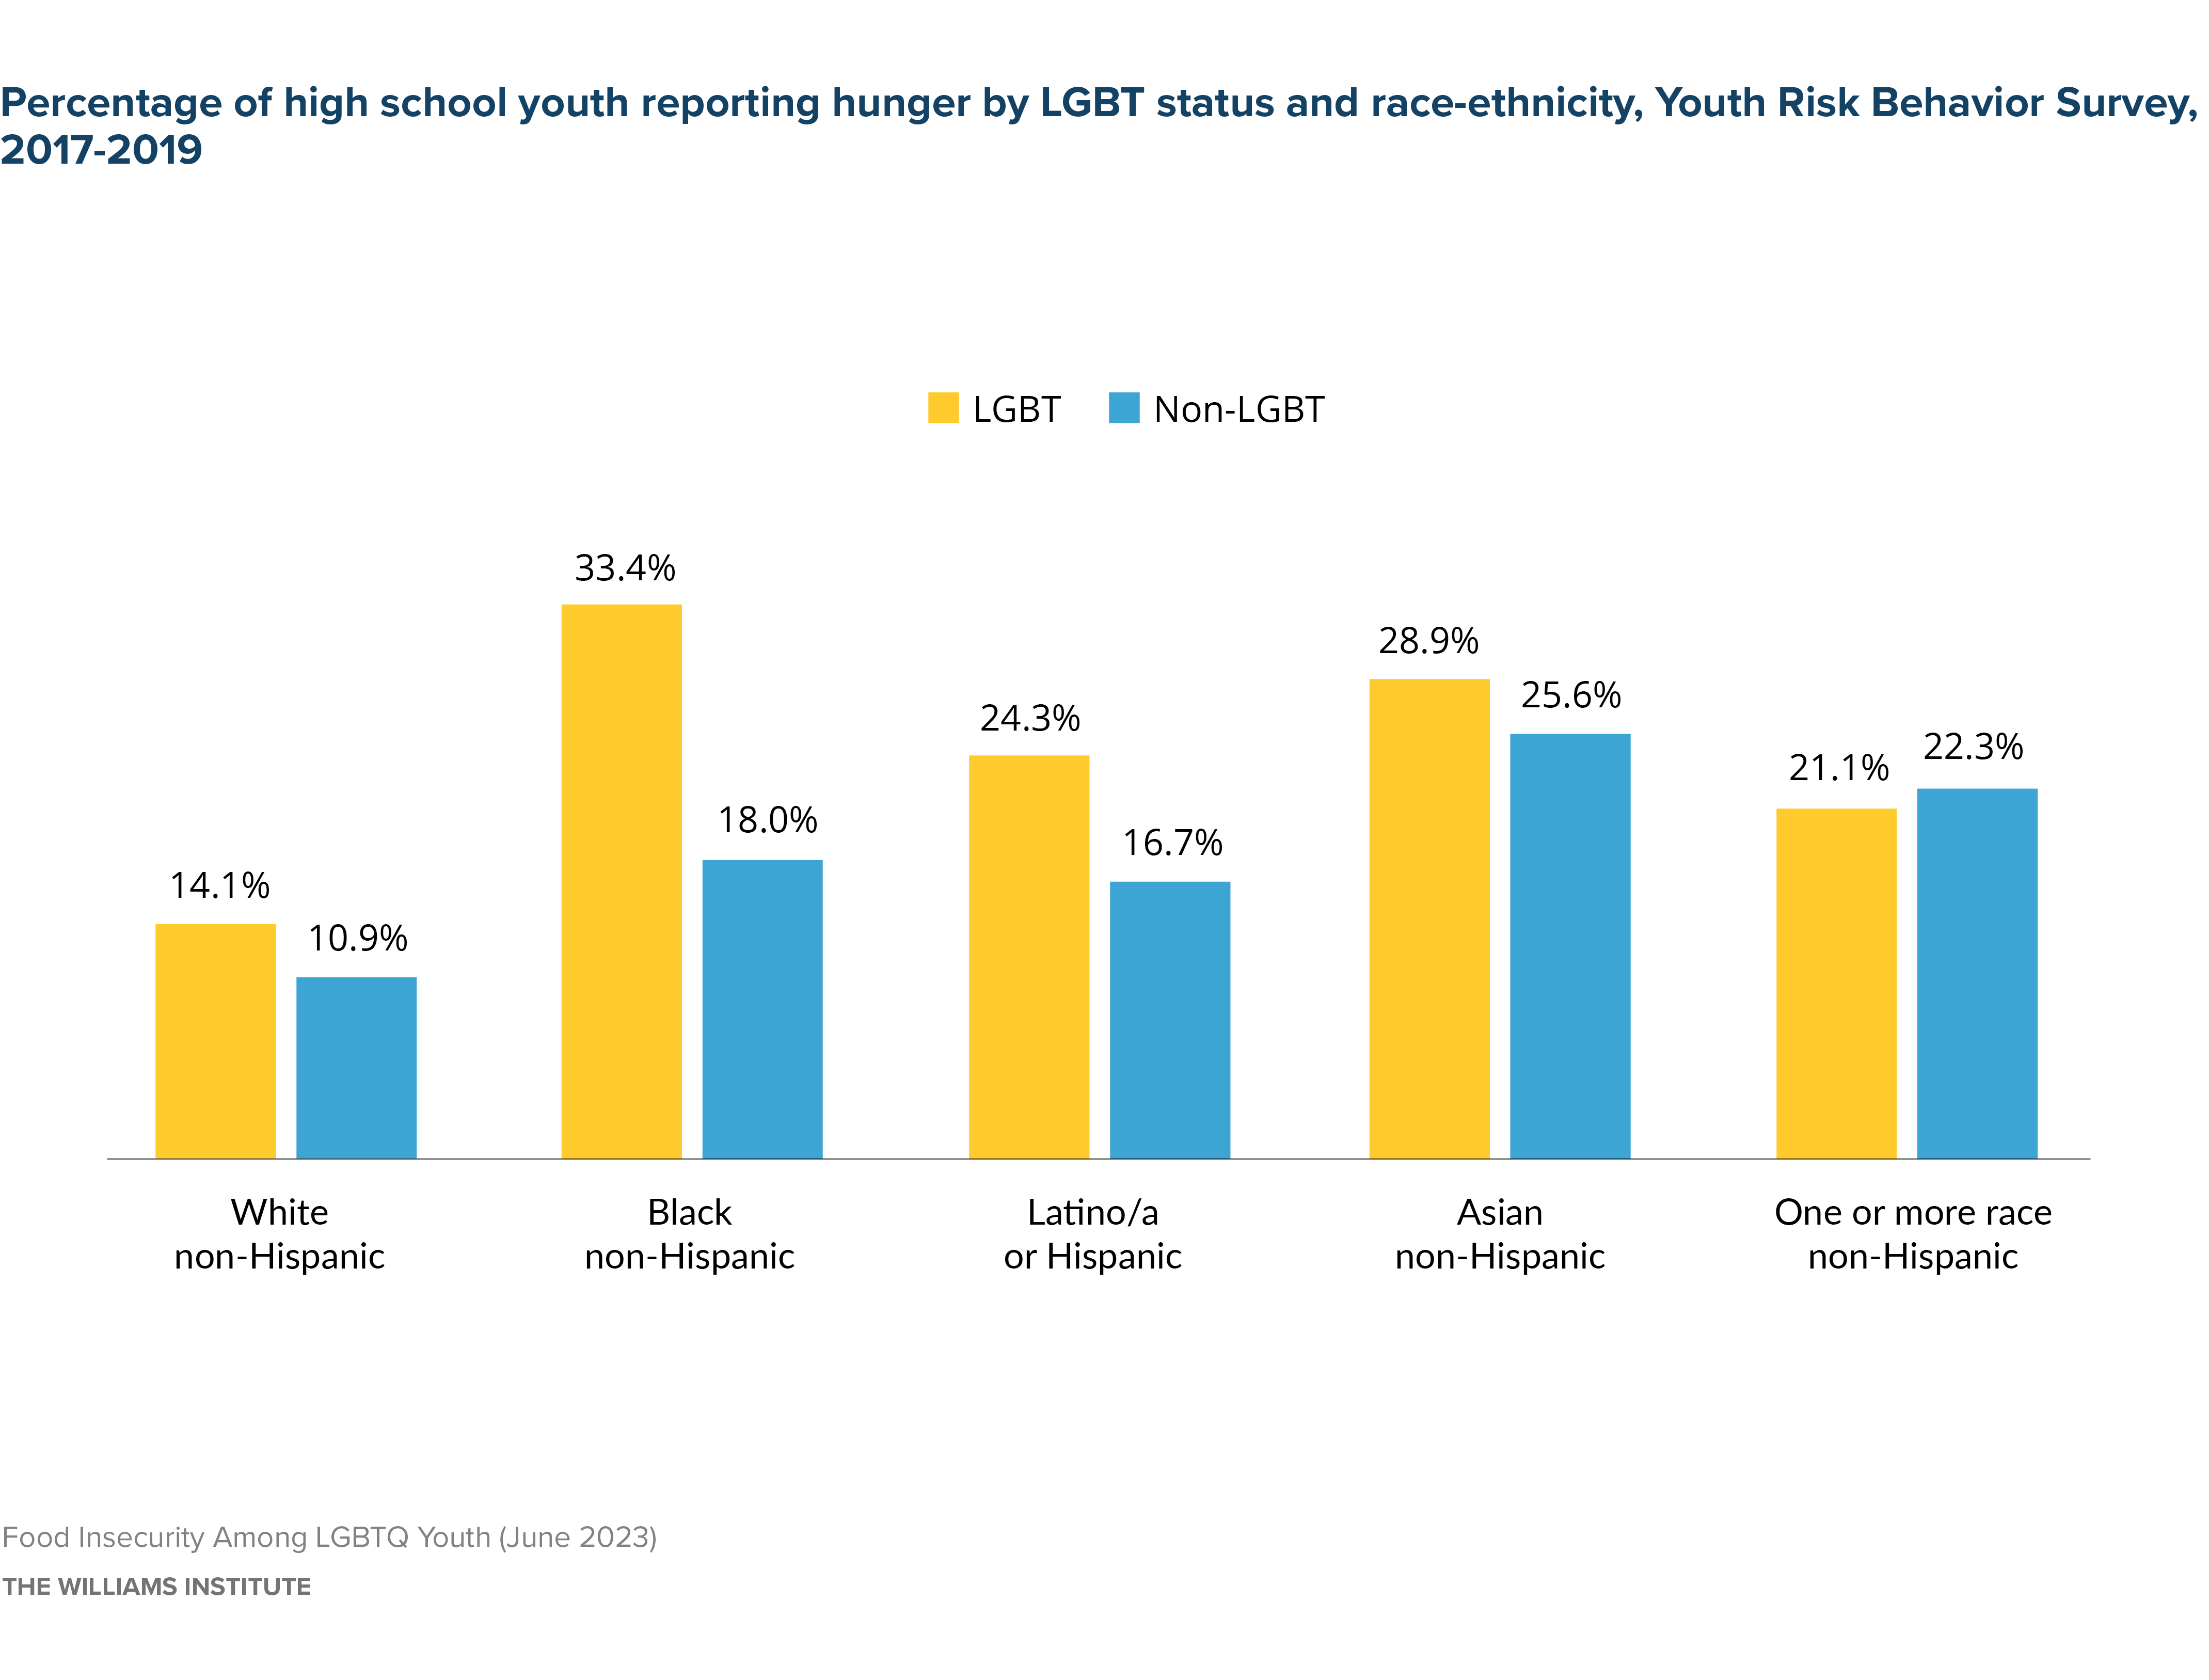
  • Racial inequities in hunger due to food insecurity exist for LGBT and non-LGBT youth alike.7
    • More Black LGBT high school students report hunger than their non-LGBT Black peers (33.4% vs. 18.0%).8
  • School-based meals served through the National School Lunch Program and the School Breakfast Program are a reliable food source for millions of U.S. students; however, accessing school-based meals is more difficult for LGBTQ youth.
    • About one in three LGBT high school youth has been bullied at school in the past year—about twice as many as their non-LGBT peers9—which increases the likelihood of skipping school,10 avoiding the cafeteria, and missing meals to be safe.11
    • Nearly a third of LGBTQ+ youth (32.2%) who completed GLSEN’s 2021 National School Climate Survey missed a day of school in the past month because they felt unsafe or uncomfortable. More than one in ten (11.3%) missed four or more days of school.12
    • More than one in five (22.2%) LGBTQ+ youth avoided lunchrooms and cafeterias because they felt unsafe or uncomfortable.13
  • Strategies to improve access to food for high school LGBTQ youth include, at minimum, preventing school-based bullying and ensuring that LGBTQ youth can access food through the National School Lunch Program.14
  • National surveillance of hunger among high school students by sexual orientation and gender identity is essential. Information about the experiences of intersex youth is also needed.

Food Insufficiency Among Youth Ages 18-24

  • More 18- to 24-year-old LGBT youth experienced food insufficiency, sometimes or often not having enough to eat, in the past week compared to their non-LGBT peers (13.9% vs. 10.1%).15
  • An estimated 703,000 LGBT 18- to 24-year-olds do not have enough to eat.16
  • Among food insufficient LGBT and non-LGBT older youth, more than half report that they could not afford to buy more food.17
    • About one-third of older LGBT and non-LGBT youth who were in the workforce between mid-July 2021 and the end of 2022 were not working in the past week.18
    • A larger proportion of older LGBT than non-LGBT youth reported difficulty paying for household expenses (16.6% vs. 12.0%) in the last week—including, but not limited to food, rent or mortgage, car payments, medical expenses, and student loans.19
  • Racial inequities in food insufficiency exist among LGBT and non-LGBT 18- to 24-year-olds. Among LGBT and non-LGBT older youth, more youth of color experience food insufficiency than their White, non-Hispanic peers.20

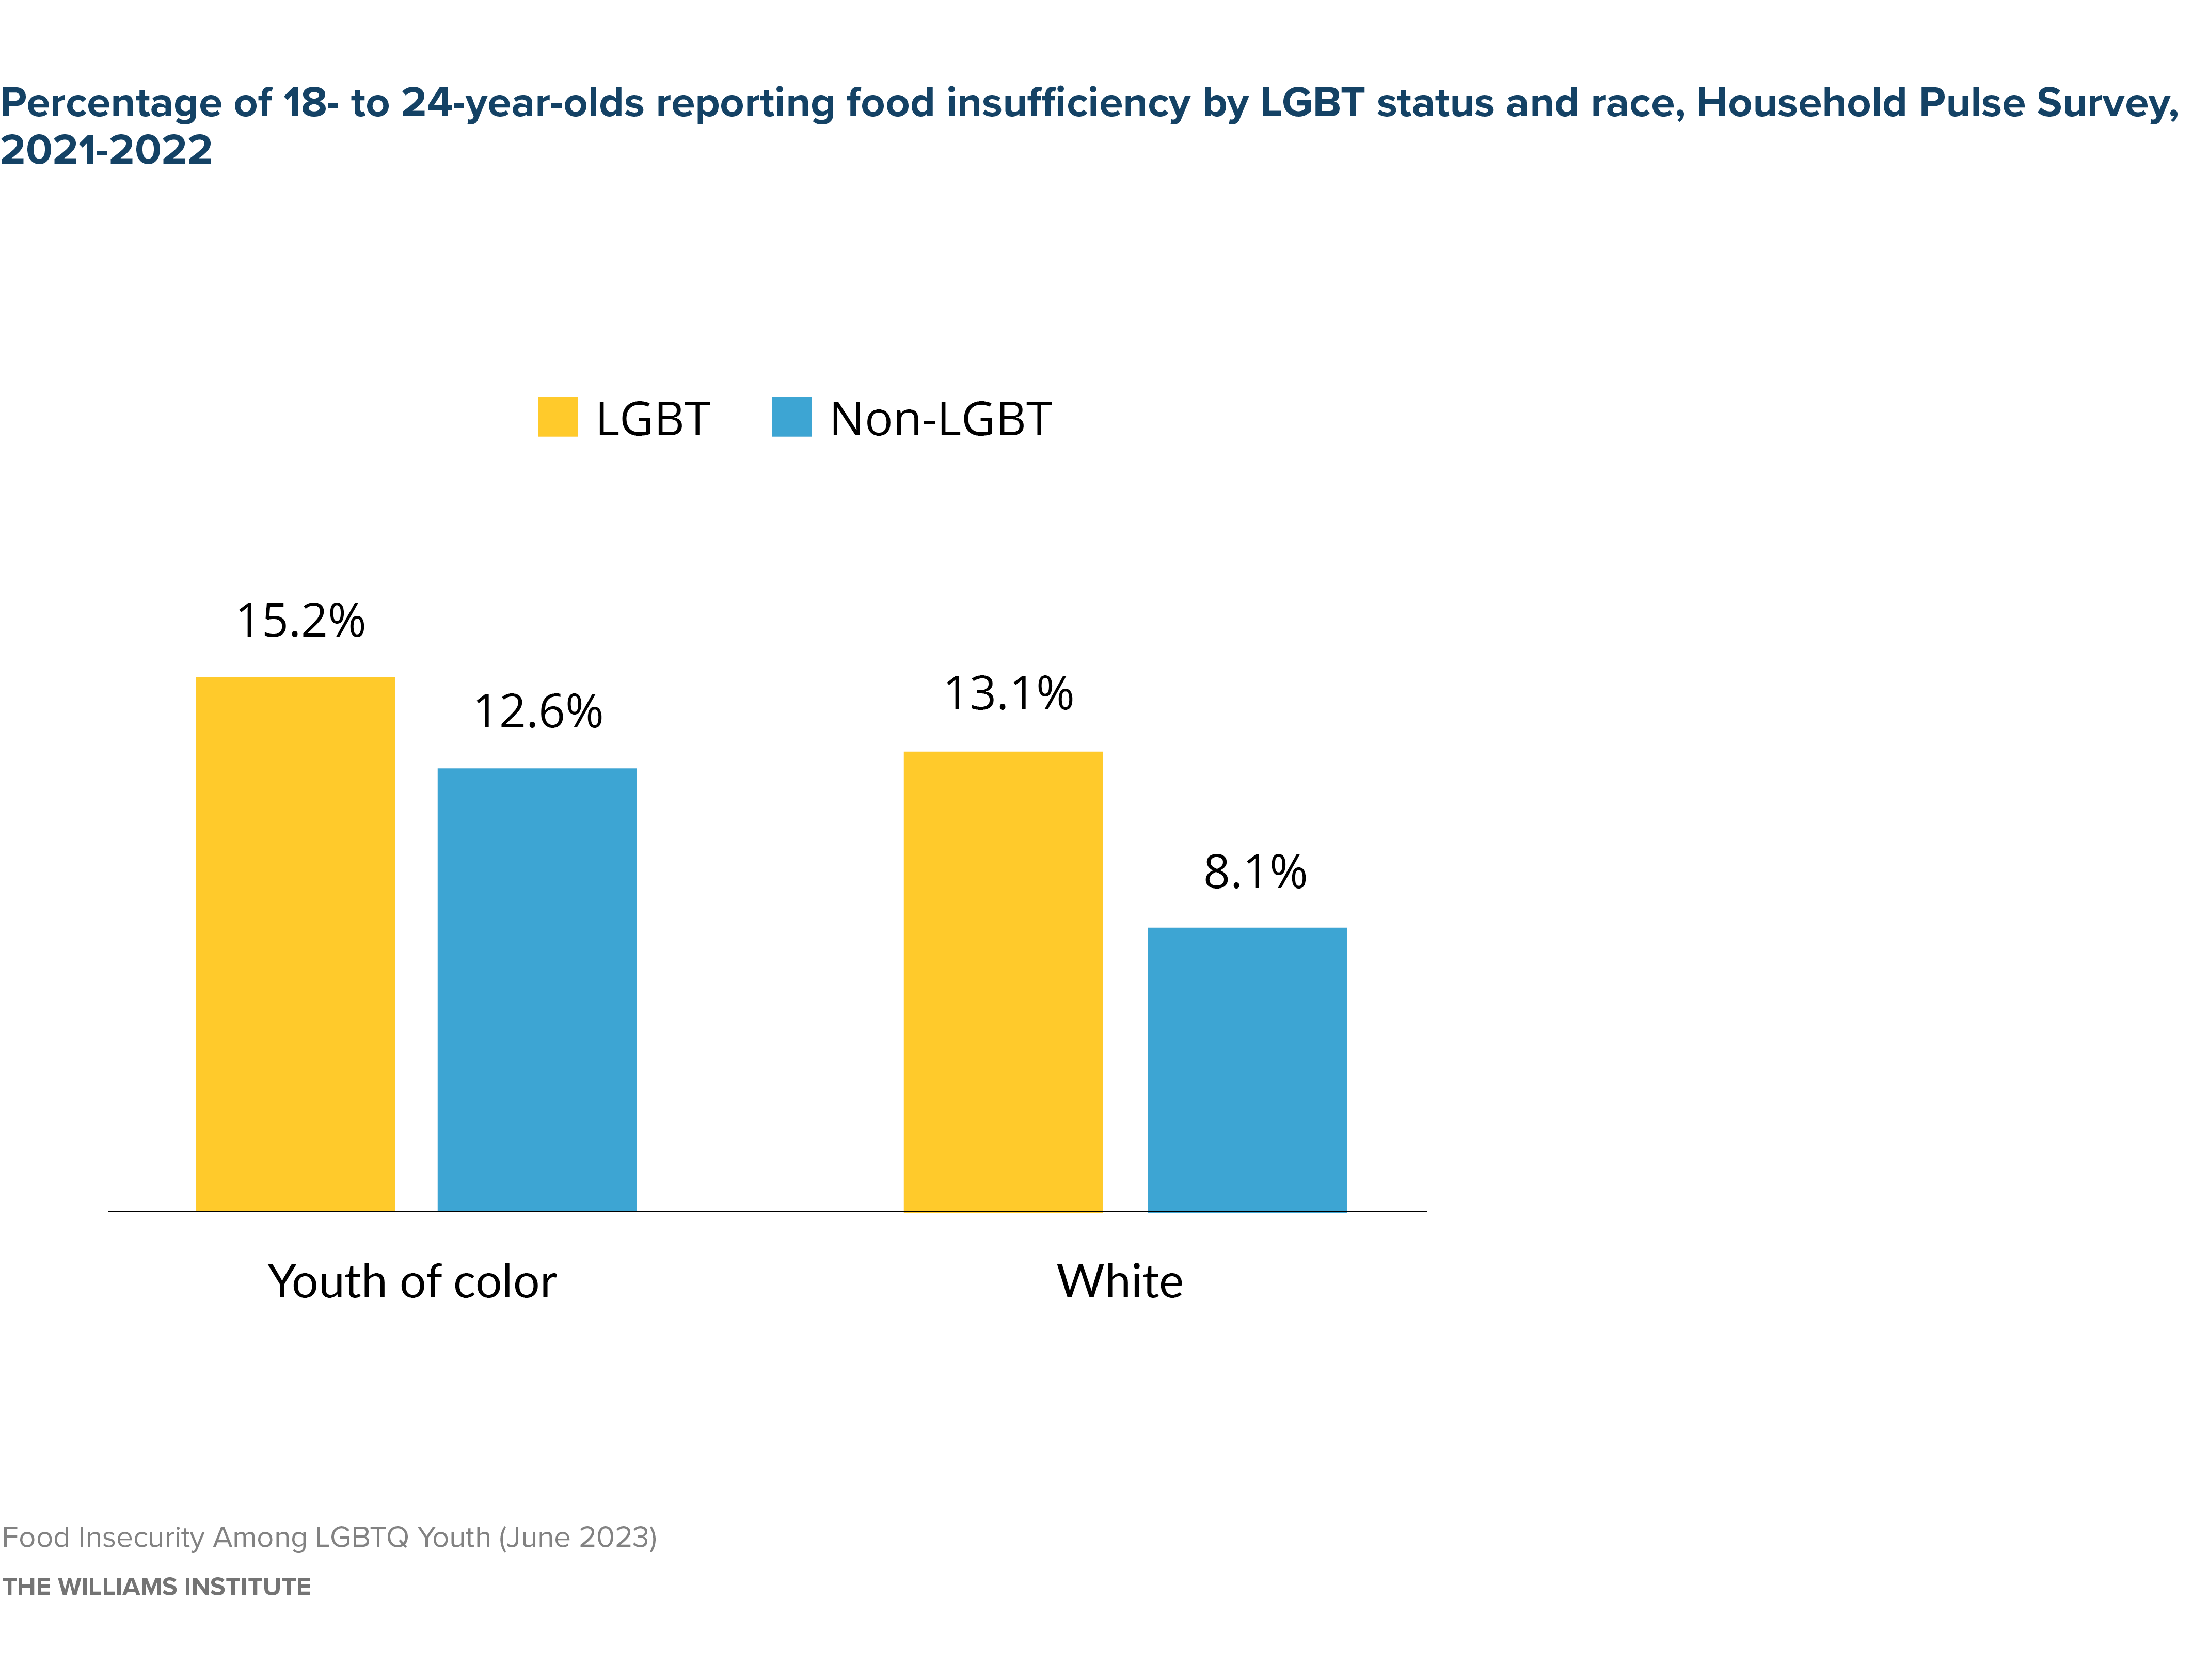
Note: Differences between White, non-Hispanic youth and youth of color were statistically significant at p<0.05 among both LGBT and non-LGBT groups.

  • Direct strategies to improve access to food for 18- to 24-year-old LGBTQ people may include SNAP outreach and enrollment and increasing access to food pantries in secular settings (e.g., college campuses, community-based youth programs).
    • Only 22.6% of income-eligible LGBT adults ages 18 and up or their household members are enrolled in SNAP.21
    • LGBTQ people may feel unwelcome at religiously affiliated food pantries and more comfortable accessing pantries at secular organizations that communicate their interest in serving them.22
  • Additional strategies to improve access to food for older LGBTQ youth may include economic interventions such as unrestricted cash transfers—which are currently being tested with homeless youth in New York City.23

Download the full brief

Food Insecurity Among LGBTQ Youth

Conron, K.J., Guardado, R., O’Neill, K., & Wilson, B.D.M. (2022). Food Insufficiency Among LGBT Adults During the COVID-19 Pandemic. The Williams Institute, UCLA, Los Angeles, CA. https://williamsinstitute.law.ucla.edu/wp-content/uploads/LGBT-Food-Insufficiency- Apr-2022.pdf

A USDA Economic Research Service. (2021). Food Security in the U.S.: Measurement: What is Food Insufficiency? https://www.ers.usda. gov/topics/food-nutrition-assistance/food-security-in-the-us/measurement/#insufficiency Accessed February 2023.

Coleman-Jensen, A., McFall, W., & Nord, M. (2013). Food Insecurity in households with children: Prevalence, severity, and household characteristics. U.S. Department of Agriculture, Economic Research Service, EIB-113. Retrieved from https://www.ers.usda.gov/webdocs/ publications/43763/37672_eib-113.pdf?v=0. ; Narula, S., Scholes, J., Simon, M., & Zureick, A. (2013). Nourishing change: Fulfilling the right to food in the United States. Technical report, New York University School of Law. Cook, J. T., & Frank, D. A. (2008). Food Security, Poverty, and Human Development in the United States. Annals of the New York Academy of Sciences, 1136(1), 193–209. https://doi.org/10.1196/ annals.1425.001; Coughenour, C., Kleven, B. C., Gakh, M., Stephen, H., Chien, L.-C., Labus, B., & Whaley, R. (2021). School absenteeism is linked to household food insecurity in school catchment areas in Southern Nevada. Public Health Nutrition, 24(15), 5074–5080. https://doi.org/10.1017/S136898002100063X; Jyoti, D. F., Frongillo, E. A., & Jones, S. J. (2005). Food Insecurity Affects School Children’s Academic Performance, Weight Gain, and Social Skills. The Journal of Nutrition, 135(12), 2831–2839. https://doi.org/10.1093/ jn/135.12.2831

A USDA Economic Research Service. (2021). Food Security in the U.S.: Measurement: What is Food Insufficiency? https://www.ers.usda. gov/topics/food-nutrition-assistance/food-security-in-the-us/measurement/#insufficiency Accessed February 2023

The difference in the proportions of LGBT and non-LGBT high school students experiencing hunger was not statistically different using an alpha of <0.05 (p=0.05). Analyses of YRBS data conducted by the Williams Institute. Please refer to the methods section for further detail.

Population estimates generated by the Williams Institute. Please refer to methods for further detail.

Analyses of the YRBS data conducted by the Williams Institute. The prevalence of hunger varied across racial-ethnic groups and is the least common about White youth and was more prevalent among youth of color—among both LGBT and non-LGBT youth. Differences between White, non-Hispanic and Black and White, non-Hispanic and Asian LGBT youth were statistically significant at p<0.05. Among non-LGBT youth, differences between White, non-Hispanic and all youth of color groups were statistically significant at p<0.05.

Analyses of the YRBS data conducted by the Williams Institute. Differences between Black LGBT and Black non-LGBT youth were statistically significant at p<0.05.

Johns, M. M., Lowry, R., Richard, Haderxhanaj, L. T., et al. (2020). Trends in Violence Victimization and Suicide Risk by Sexual Identity Among High School Students — Youth Risk Behavior Survey, United States, 2015–2019.MMWR Suppl 2020;69(Suppl-1):19–27. DOI: http://dx.doi. org/10.15585/mmwr.su6901a3external icon; Johns M.M., Lowry, R., Andrzejewski J., et al. Transgender Identity and Experiences of Violence Victimization, Substance Use, Suicide Risk, and Sexual Risk Behaviors Among High School Students — 19 States and Large Urban School Districts, 2017. MMWR 2019; 68:67–71. http://dx.doi.org/10.15585/mmwr.mm6803a3 https://www.cdc.gov/mmwr/ volumes/69/su/pdfs/su6901a3-H.pdf; https://www.cdc.gov/mmwr/volumes/68/wr/mm6803a3.htm

Steiner, R. J. & Rasberry, C. N. (2015). Brief report: Associations between in-person and electronic bullying victimization and missing school because of safety concerns among U.S. high school students. Journal of Adolescence, 43, 1–4. https://doi.org/10.1016/j. adolescence.2015.05.005 https://stacks.cdc.gov/view/cdc/117704

Kosciw, J.G., Clark, C. M., & Menard, L. (2022). The 2021 National School Climate Survey: The Experiences of LGBTQ+ Youth in Our Nation’s Schools. https://www.glsen.org/sites/default/files/2022-10/NSCS-2021-Full-Report.pdf

Kosciw, J.G., Clark, C. M., & Menard, L. (2022). The 2021 National School Climate Survey: The Experiences of LGBTQ+ Youth in Our Nation’s Schools. https://www.glsen.org/sites/default/files/2022-10/NSCS-2021-Full-Report.pdf

Kosciw, J.G., Clark, C. M., & Menard, L. (2022). The 2021 National School Climate Survey: The Experiences of LGBTQ+ Youth in Our Nation’s Schools. https://www.glsen.org/sites/default/files/2022-10/NSCS-2021-Full-Report.pdf

Akhtar, S, & Deabler, K. (2022). Twenty-two States Are Trying to Deny Free School Lunch to LGBTQ Students. National Center for Law and Economic Justice, New York, CA. https://nclej.org/news/twenty-two-states-are-trying-to-deny-free-school-lunch-to-lgbtq-students https://nclej.org/news/twenty-two-states-are-trying-to-deny-free-school-lunch-to-lgbtq-students

Analyses of Household Pulse data conducted by the Williams Institute. Please refer to methods for further detail.

Population estimates generated by the Williams Institute. Please refer to methods for further detail.

Analyses conducted by the Williams Institute.

Analyses conducted by the Williams Institute.

Analyses conducted by the Williams Institute.

Analyses conducted by the Williams Institute. Differences between White, non-Hispanic youth and youth of color were statistically significant at p<0.05 among both LGBT and non-LGBT groups.

Conron, K.J., Guardado, R., O’Neill, K., & Wilson, B.D.M. (2022). Food Insufficiency Among LGBT Adults During the COVID-19 Pandemic. The Williams Institute, UCLA, Los Angeles, CA. https://williamsinstitute.law.ucla.edu/wp-content/uploads/LGBT-Food-Insufficiency- Apr-2022.pdf. Data are reported for adults of all ages given challenges ascertaining economic independence/dependence of young adult respondents to the Household Pulse Survey.

Wilson, B.D.M., Badgett, M. V. L., & Gomez, A. G. H. (2020). Experiences with Food Insecurity and Food Programs Among LGBTQ People. The Williams Institute, Los Angeles, CA. https://williamsinstitute.law.ucla.edu/wp-content/uploads/LGBTQ-Food-Bank-Jun-2020.pdf; Russomanno, J. & Jabson Tree, J.M. (2020). Food insecurity and food pantry use among transgender and gender non-conforming people in the Southeast United States. BMC Public Health 20, 590.

Chapin Hall at The University of Chicago. (2021). Public-Private Partnership Launches the First Direct Cash Transfer Study for Addressing Young Adult Homelessness. Chicago, IL. https://www.chapinhall.org/news/public-private-partnership-launches-the-first-direct-cash-transfer-study-for-addressing-young-adult-homelessness/ https://www.nyc.gov/office-of-the-mayor/news/444-21/recovery-all-us-city-new-york-chapin-hall-point-source-youth-launch-goundbreaking