Executive Summary
Analyzing data from the 2013 US American Community Survey, this report considers the demographic, economic, and geographic characteristics of same-sex couples (married and unmarried), especially those raising children, in Kentucky, Michigan, Ohio, and Tennessee. Comparisons are made with their different-sex counterparts.
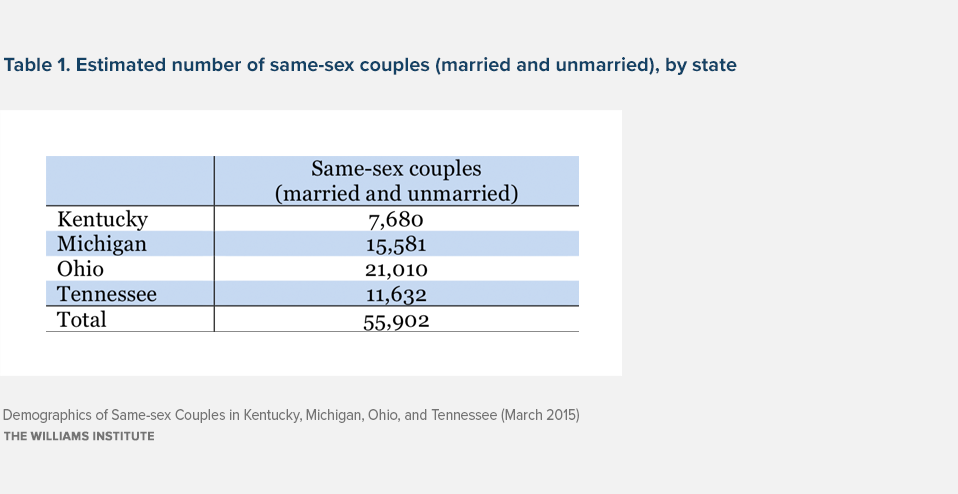
In Kentucky, Michigan, Ohio, and Tennessee, as of 2013, there are an estimated 55,902 same-sex couples. Nearly 11% of these couples report being married, meaning that there were nearly 6,100 married same-sex couples in these states in 2013.
An estimated 11,000 same-sex couples (married and unmarried) are raising children under age 18 in Kentucky, Michigan, Ohio, and Tennessee. In these states, the median annual household income of these couples is more than 30% lower than the median annual household income of married different-sex couples raising children ($56,000 versus $79,000). More than a third of children being raised by same-sex couples (35%) live in poverty compared to 10% of children being raised by different-sex married parents.
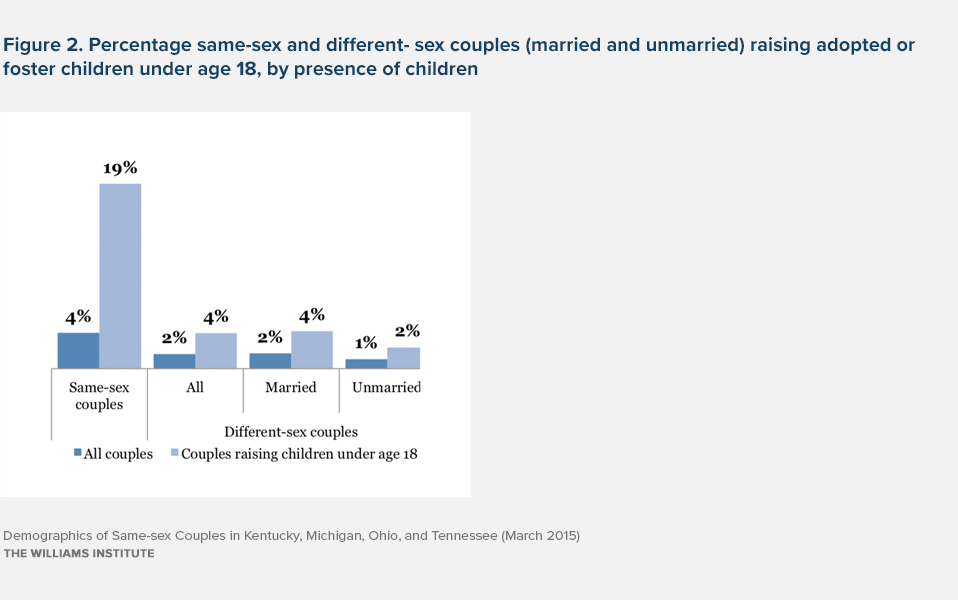
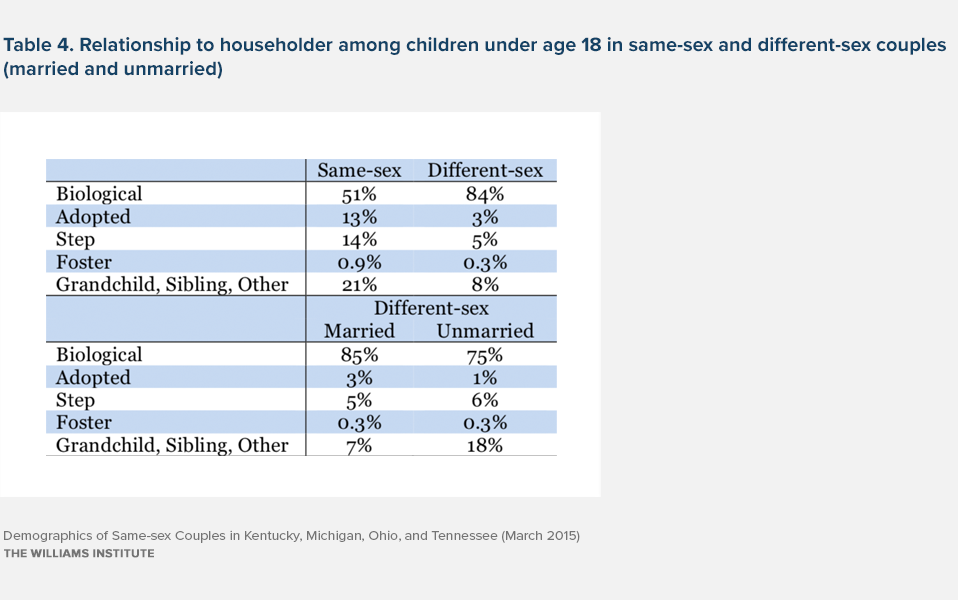
Even though many same-sex couples in Kentucky, Michigan, Ohio, and Tennessee face more restrictive laws regarding adoption and fostering in their home states, they are more likely to have adopted or foster children than their different-sex counterparts. Same-sex couples are twice as likely as married different-sex couples to have an adopted or foster child (4% versus 2%, respectively). An estimated 3,260 adopted or foster children are being raised by same-sex couples in Kentucky, Michigan, Ohio, and Tennessee.
Key Findings
- Census 2010 figures suggest that same-sex couples are present in 94% of counties across the four states.
- A majority of same-sex couples in these states are female (54%).
- The average age of individuals in same-sex couples in Kentucky, Michigan, Ohio, and Tennessee is nearly 9 years younger than that of married different-sex couples—42.2 and 51.4 years old, respectively.
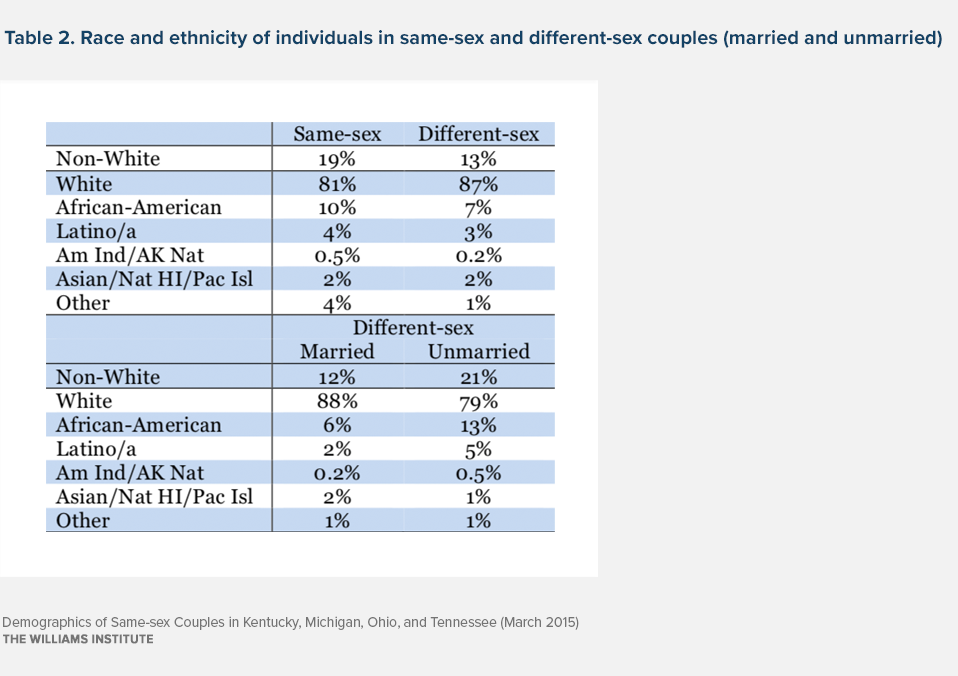
- In these four states, individuals in same-sex couples are more likely to be members of racial and ethnic minorities when compared to individuals in married different-sex couples, 19% and 12%, respectively.
- Same-sex couples (both with and without children) in Kentucky, Michigan, Ohio, and Tennessee have the same median annual household income than that of married different-sex couples ($72,000).
- Individuals in same-sex couples are much more likely to be living in poverty than their married different-sex counterparts (23% versus 5%, respectively).
- Individuals in same-sex couples are less likely to own their homes than their married different-sex counterparts (66% versus 85%, respectively).
Introduction
In spring 2015, the US Supreme Court will hear arguments in cases from Kentucky, Michigan, Ohio, and Tennessee challenging the constitutionality of those states’ bans on marriage for same-sex couples.
These analyses consider the demographic, economic, and geographic characteristics of same-sex couples (married and unmarried), especially those raising children, in Kentucky, Michigan, Ohio, and Tennessee. Comparisons are made with their different-sex counterparts.
Prior analyses of same-sex couples using US Census Bureau data have documented difficulties associated with an accurate measurement, particularly of married same-sex couples (Gates and Steinberger, 2009; O’Connell and Feliz, 2011; Cohn, 2014). These difficulties occur when very small portions of surveys from different-sex couple households include miscodes in the sex of the spouses or partners such that they appear to be a same-sex couple. Even small numbers of such miscodes among different-sex couples mean that a relatively large portion of the same-sex couple sample includes miscoded different-sex couples. Since nearly 90% of different-sex couples are married, the accuracy of the married same-sex couple sample has been shown to be more compromised.
These analyses make several adjustments to the data to improve the likelihood that observed same-sex couples, particularly married same-sex couples, are not miscoded different-sex couples. These adjustments remove responses from the sample that are most likely to be comprised of miscoded different-sex couples. Several of the adjustments remove households where responses to key variables used to determine if a couple is same-sex or different-sex and if a couple is married or not have been “allocated.” Census Bureau procedures allocate a variable if the original response was missing or there was an anomaly in the response. In those cases, statistical procedures are used to assign the most likely accurate response.
The adjustment procedure for these analyses removes responses from the analytical sample if:
- The sex of a partner or spouse in a same-sex or different-sex couple is allocated.
- The marital status of a partner or spouse in a same-sex or different-sex couple is allocated.
- Spouses in same-sex and different-sex couples report being currently married but record different years when the marriage occurred.
- Spouses in same-sex couples report that their marriage occurred prior to 2004, when Massachusetts became the first state to permit same-sex couples to marry.
It is possible that the adjustment procedure removes a small number of valid same-sex couples who report being married prior to 2004. Same-sex couples have been able to legally marry in some countries outside of the US since 2001. Further, some couples who had civil unions, registered domestic partnerships, or commitment ceremonies could report the dates of those occasions (regardless of when a legal marriage actually occurred) as some of those statuses automatically converted to marriage or couples just view those dates as more significant than the date of a legal marriage.
The 2013 ACS PUMS for the entire United States includes 617,090 married different-sex couple households and 8,340 same-sex couple households, of which 3,102 are married and 5,238 are unmarried. The adjustment procedure removes 48,506 married different-sex couple households from the analyses (nearly 8%). It removes 2,346 same-sex couple households (married and unmarried), accounting for 28% of the original sample. This is consistent with prior estimates of the portion of same-sex couples that are likely miscoded different-sex couples (Gates and Steinberger, 2009; O’Connell and Feliz, 2011). Also consistent with prior analyses of the accuracy of same-sex couple samples in Census Bureau data, the adjustment results in proportionally more observations being removed among married same-sex couples (55%) than among unmarried same-sex couple households (12%).
The sample used in these analyses includes 61,859 married different-sex couple households, 5,967 unmarried different-sex couple households, and 428 same-sex couple (married and unmarried) households. The sample includes 65 same-sex couples in Kentucky, 120 in Michigan, 206 in Ohio, and 95 in Tennessee. There were also 58 married same-sex couples across the four states. The small samples of married same-sex couples and of same-sex couples within each of the four states limit the ability to make reliable estimates of characteristics of married versus unmarried same-sex couples and of characteristics within particular states. As a result, these analyses report characteristics of all same-sex couples (married and unmarried combined) across the four states whose cases are before the Supreme Court.
Demographics of couples
Because of the challenges associated with accurate measurement of same-sex couples in the ACS and the necessity of adjusting samples to improve the validity of the same-sex couple sample, it is difficult to use the ACS data to provide accurate estimates of the total number of same-sex couples in the US or in particular states.
Analyses of the 2013 National Health Interview Survey (NHIS) indicate that in the United States there are approximately 690,000 same-sex couples (including both married and unmarried couples), meaning that nearly 1.4 million Americans are members of a same-sex couple (Gates 2014). This marked an increase from the “preferred” estimates of same-sex couples based on the adjustments made by the US Census Bureau to Census 2010 data to correct the measurement problems described above, which suggested that there were 646,464 same-sex couples in the country (O’Connell & Feliz, 2011).
To generate current estimates for the number of same-sex couples in Kentucky, Michigan, Ohio, and Tennessee, the assumption is made that the number of same-sex couples in the US has increased since 2010 to 690,000 but the proportion in particular states remains the same as in 2010.
An estimated 55,902 same-sex couples live in Kentucky, Michigan, Ohio, and Tennessee. The figures for each state are shown in Table 1. Census 2010 figures suggest that same-sex couples are present in 94% of counties across the four states (Gates and Cooke, 2011a; Gates and Cooke, 2011b; Gates and Cooke 2011c; Gates and Cooke, 2011d).