Executive Summary
LGBT older adults, defined in this study as those over 50 years old, face significant and unique challenges to health and well-being as they age. They are more likely than their straight/cisgender peers to experience social and economic barriers that prevent healthy aging. Research has shown that the COVID-19 pandemic has increased economic and social instability for LGBT people of all ages. However, precarity is not new for LGBT older adults and COVID-19 may be viewed as part of a continuum of disruptive events that impact the aging experiences of LGBT older adults.
Using data from the U.S. Census Household Pulse Survey (HPS) collected July 21, 2021 to August 8, 2022, we explore the demographics, health, and economic experiences of older LGBT adults during the COVID-19 pandemic as compared with straight/cisgender older adults. This analysis used the first U.S. Census Bureau data that has included questions about sexual orientation and gender identity (SOGI), which gives researchers an opportunity to use a nationally representative sample to describe the health and well-being of LGBT and straight/cisgender older adults. The analytic sample was limited to 533,179 survey respondents who were over age 50 and could be classified as LGBT or non-LGBT based on their responses to the survey questions.
Key Findings
Demographic Characteristics
- More people aged 50–64 identified as LGBT than those aged 65 years and older (4.4% vs. 2.4%, respectively).
- In both 50–64 and 65+ age cohorts, more men than women identified as LGBT; the opposite is true for younger LGBT adults.
- In both the age cohorts, more LGBT than straight/cisgender adults obtained higher levels of education (50–64 cohort: 67% vs. 59%; 65+ cohort: 71% vs. 57%, respectively), and more LGBT adults lived alone (50–64 cohort: 18% vs. 8%; 65+ cohort: 25% vs. 15%, respectively).
- Although far more LGBT people had never been married (50–64 cohort: 36% vs. 8%; 65+ cohort: 29% vs. 4%, respectively), LGBT and straight/cisgender people had similar rates of divorce/separation in both cohorts (50–64 cohort: 20% vs. 21%; 65+ cohort: 21% vs. 17%, respectively).
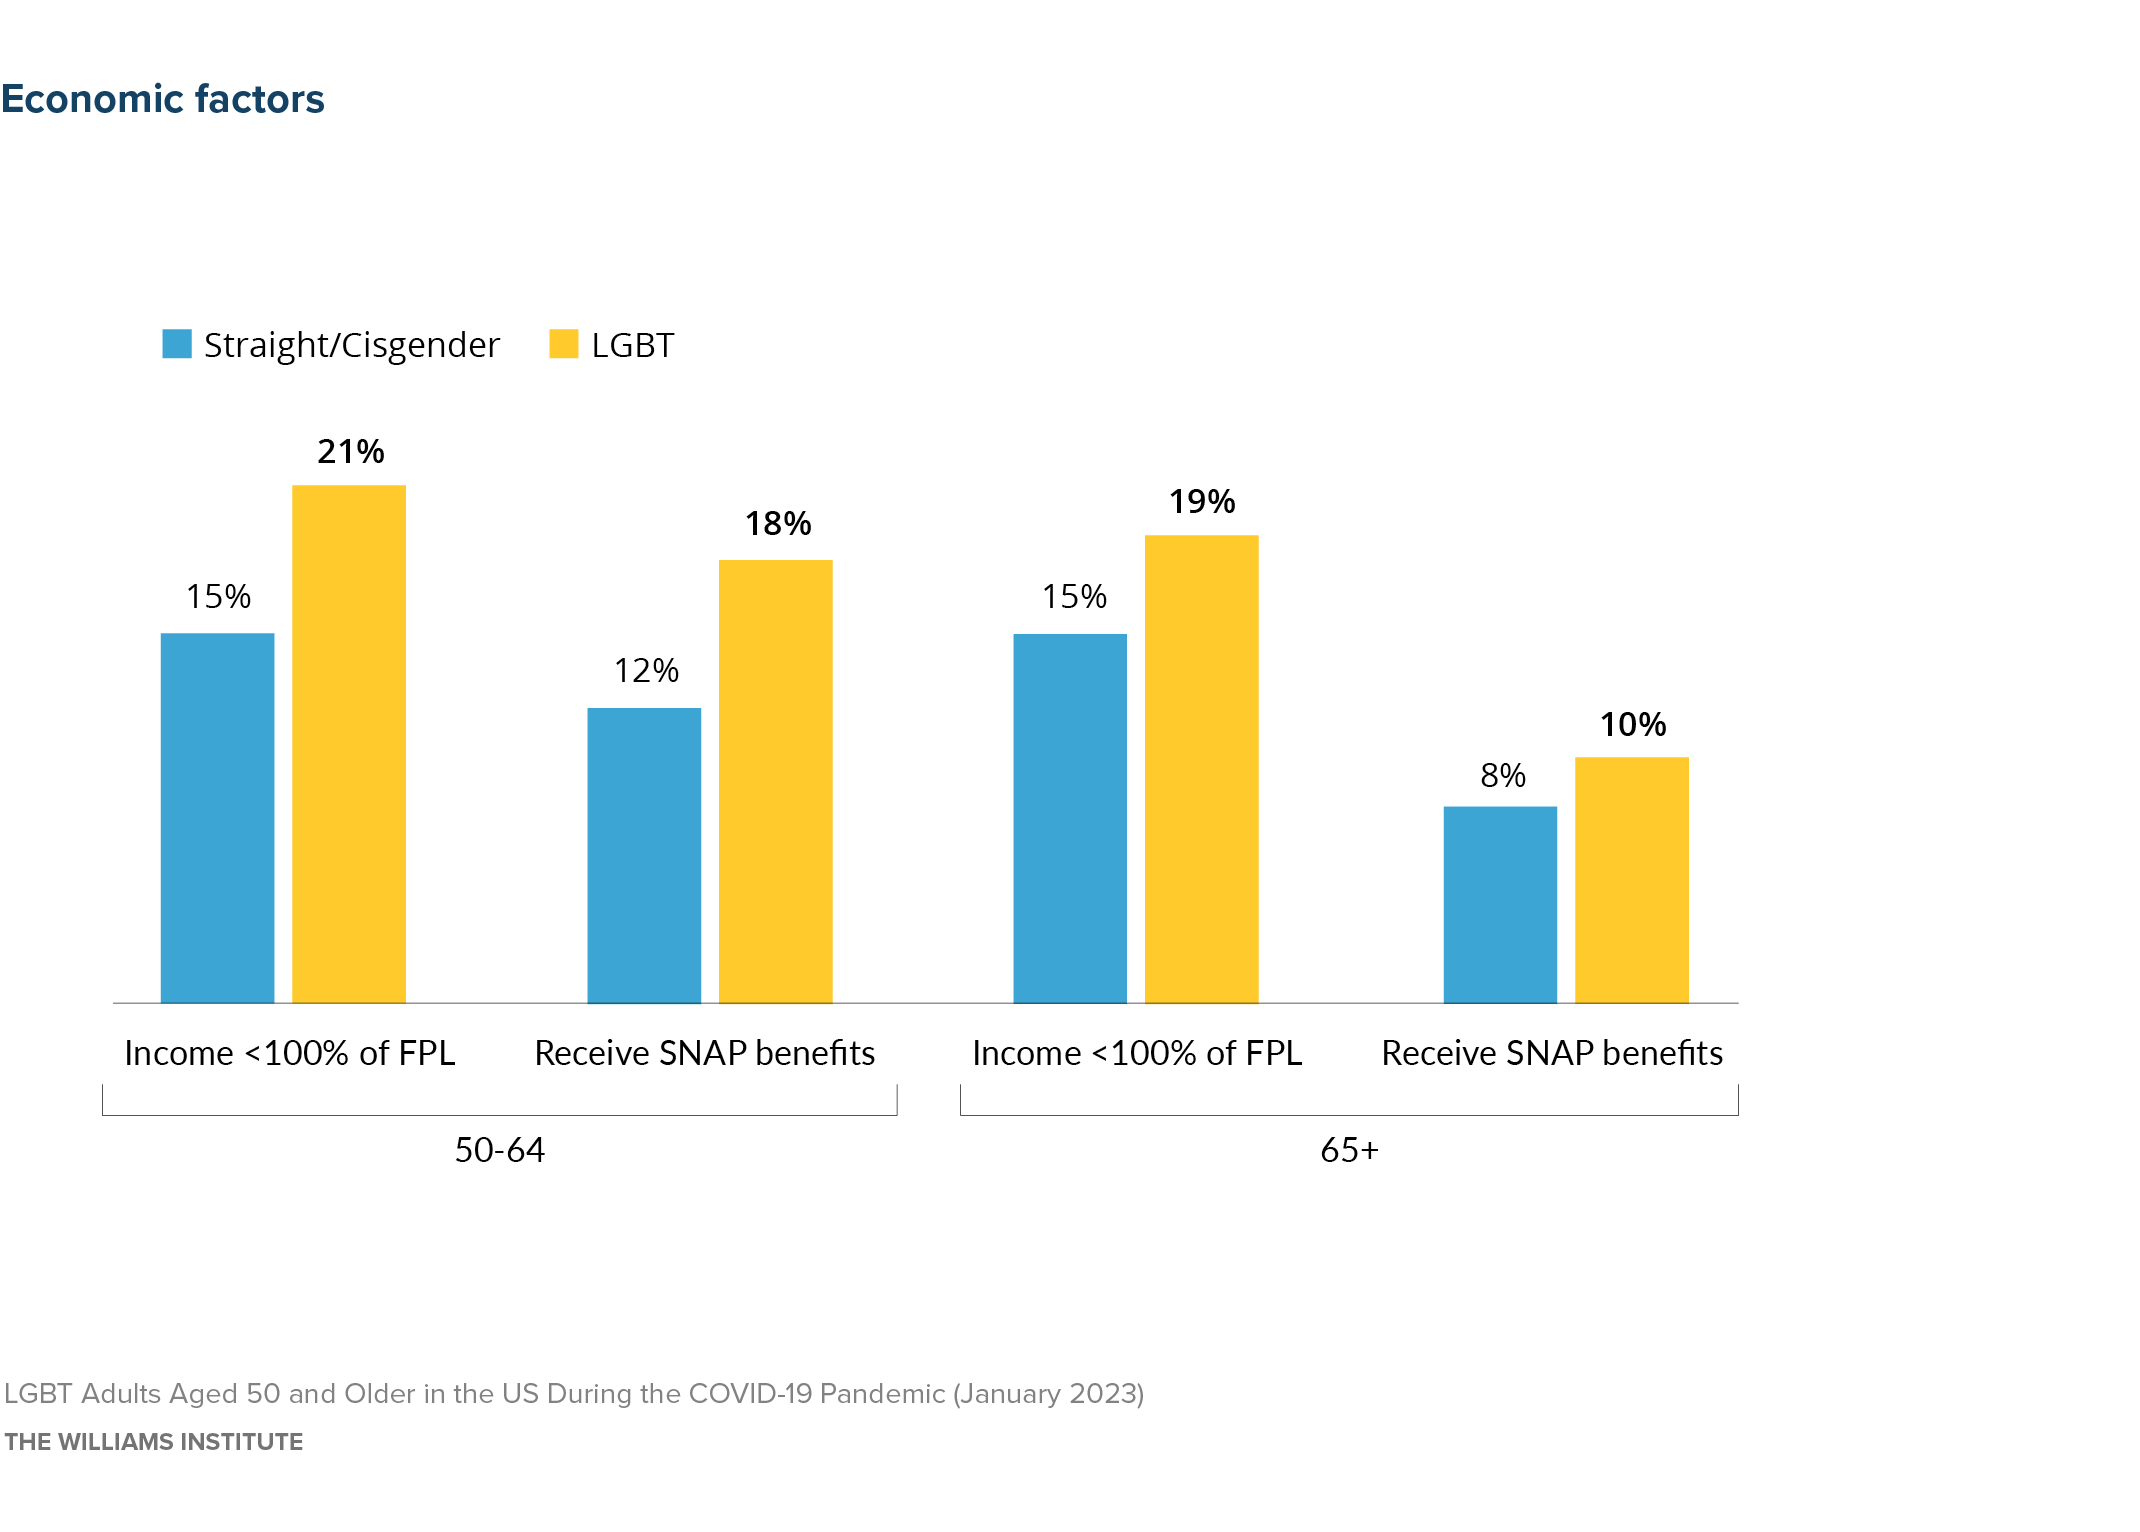
Source: U.S. Census Household Pulse Survey (July 2021–August 2022)
Note: Bolded values indicate LGBT people are statistically different from straight/cisgender people.
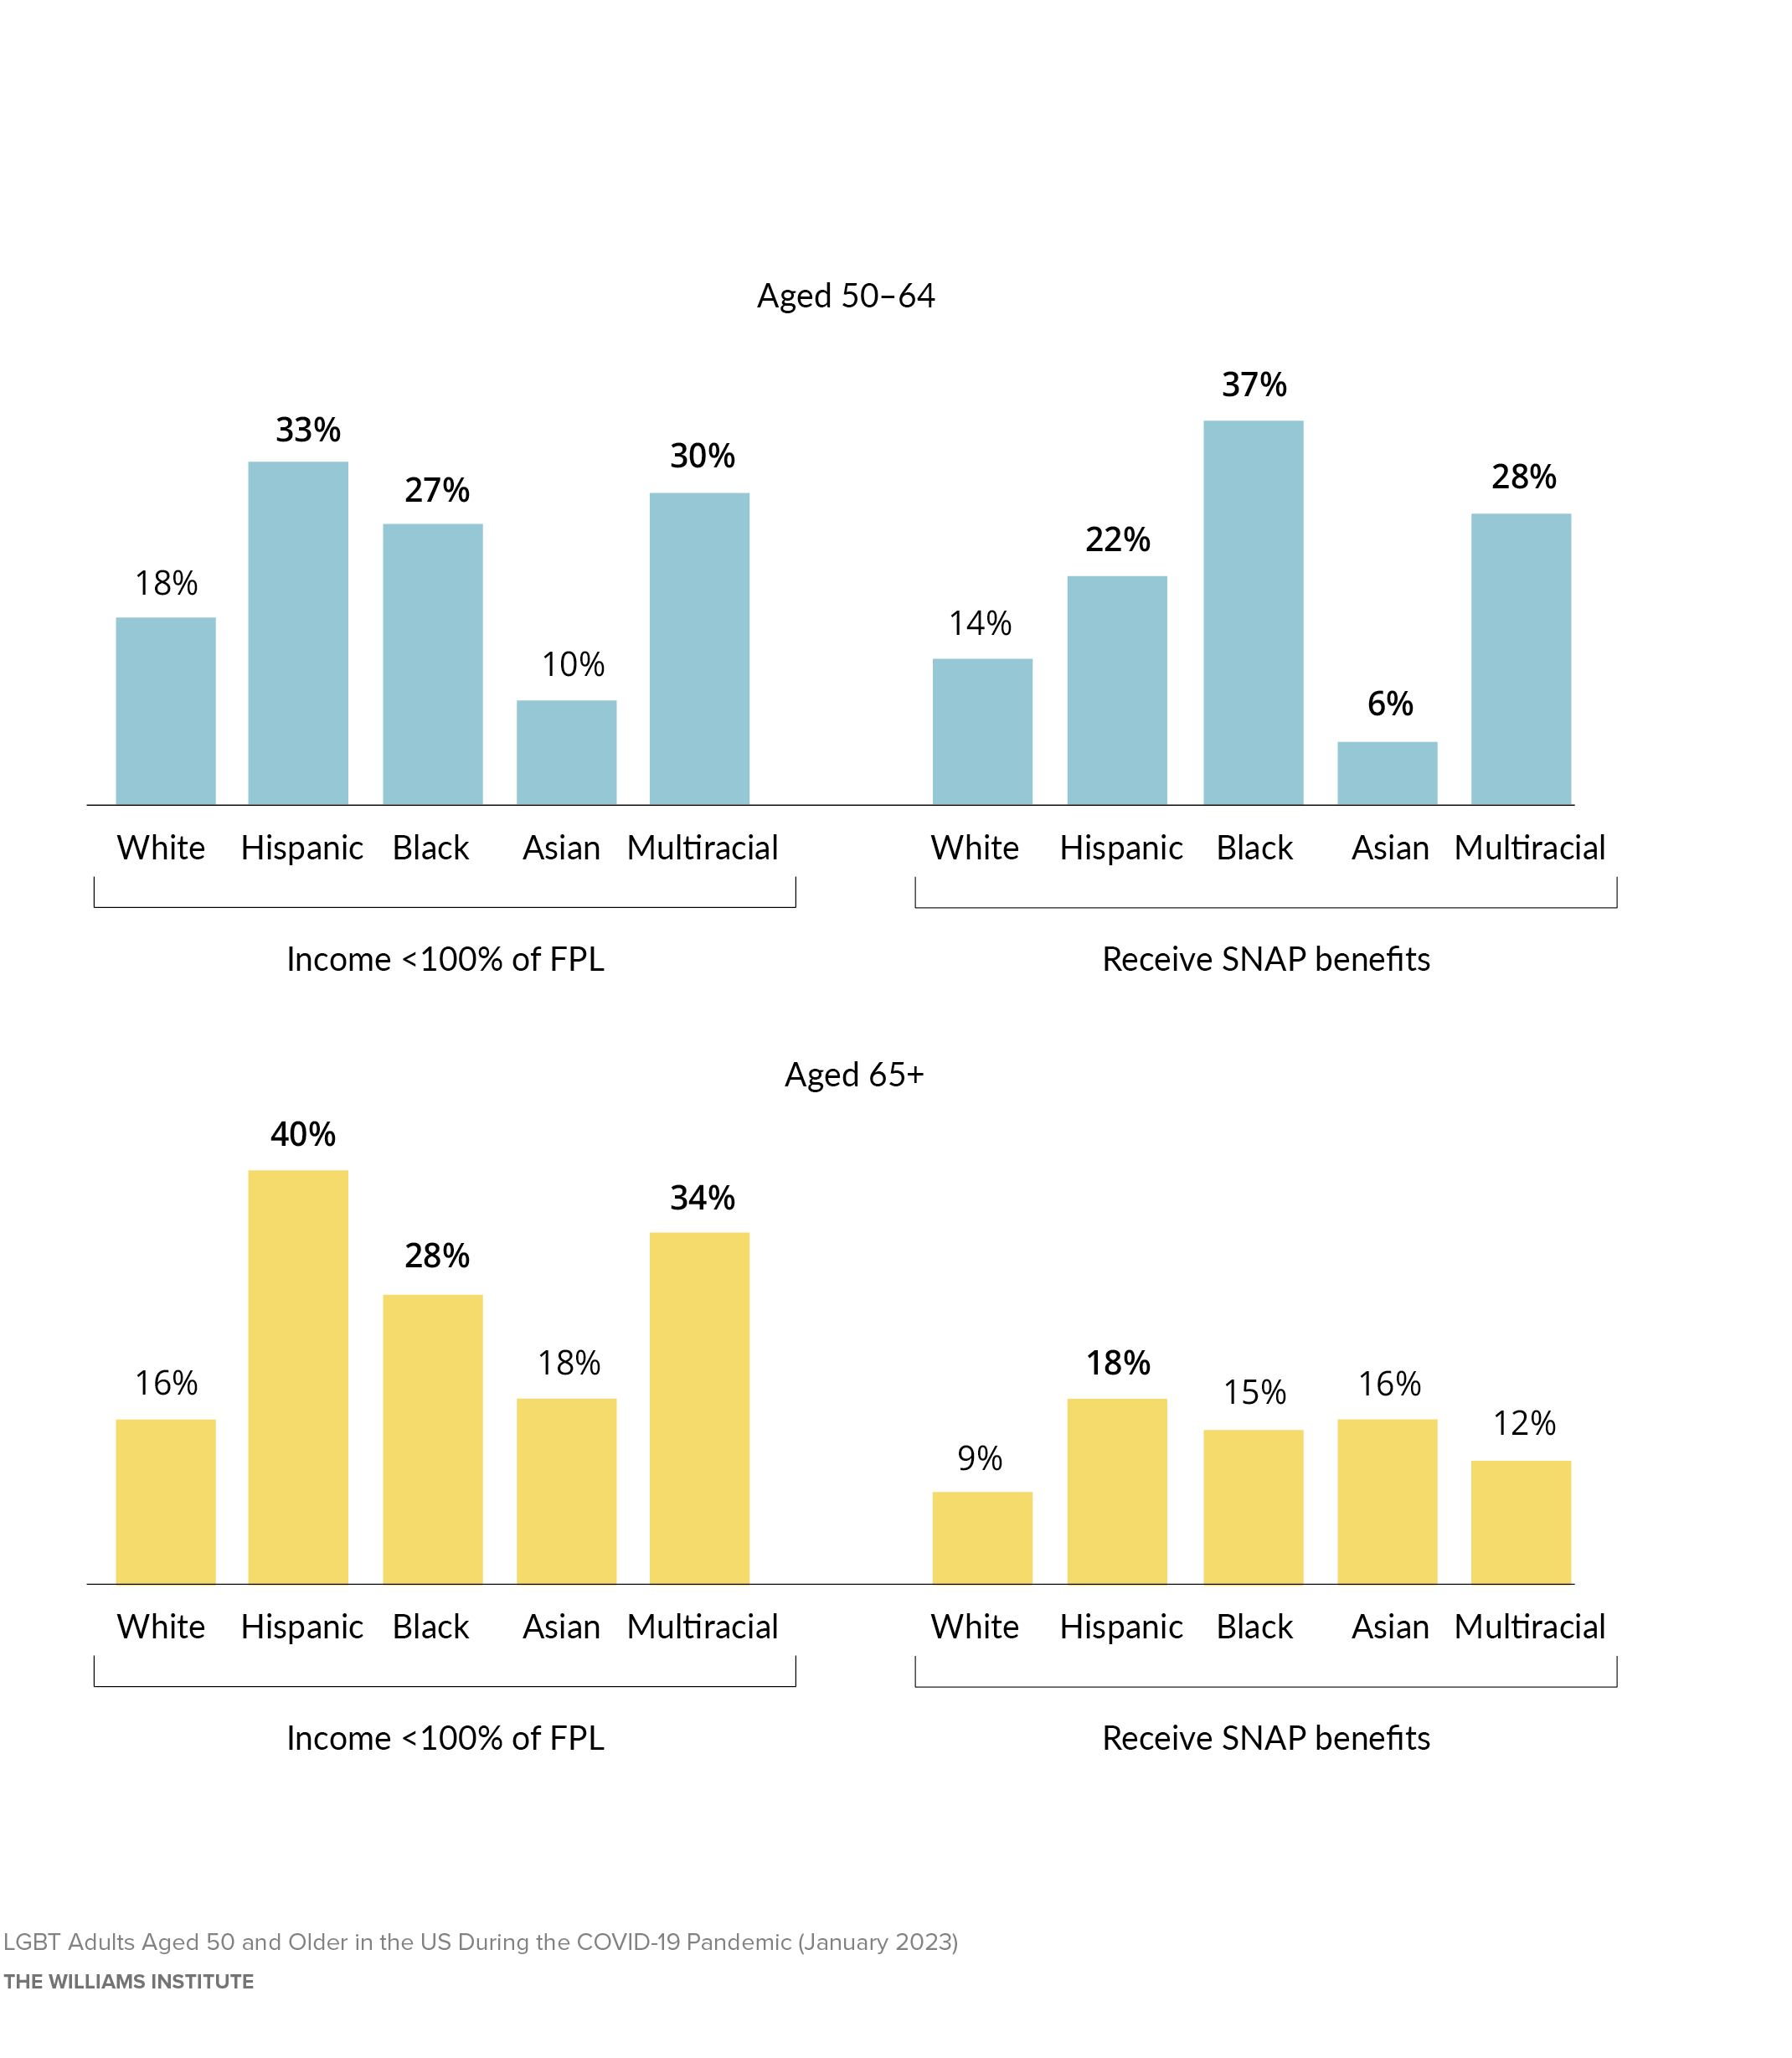
Source: U.S. Census Household Pulse Survey (July 2021–August 2022)
Note: Bolded values indicate that race/ethnicity is statistically different from White.
Among LGBT people there was pronounced economic disparity by race/ethnicity. In both cohorts, more Black, Hispanic, and Multiracial LGBT adults had household incomes that fell below the federal poverty level compared to White and Asian LGBT adults. Among those aged 50–64, exponentially more Black LGBT people were receiving SNAP benefits, while few Asian LGBT people were. In the 65+ cohort more Hispanic than White LGBT people were receiving SNAP benefits.
Additionally, compared to White LGBT people, more Black LGBT adults from both cohorts reported not having enough food to eat (50–64 cohort: 9% vs. 15%; 65+ cohort: 3% vs. 14%), renting rather than owning their homes (50–64 cohort: 24% vs. 53%; 65+ cohort: 18% vs. 51%), and having trouble paying household expenses (50–64 cohort: 28% vs. 46%; 65+ cohort: 18% vs. 41% ).
- Compared to White LGBT people, more Hispanic LGBT adults from both cohorts reported not having enough food to eat (50–64 cohort: 9% vs. 21%; 65+ cohort: 3% vs. 14%), renting rather than owning their homes (50–64 cohort: 24% vs. 46%; 65+ cohort: 18% vs. 39%), having trouble paying household expenses (50–64 cohort: 28% vs. 47%; 65+ cohort: 18% vs. 40%), and keeping the temperature of their homes at unsafe levels (50–64 cohort: 20% vs 33%; 65+ cohort: 14% vs. 27%).
- In both cohorts, compared to White LGBT adults, Multiracial LGBT adults reported keeping the temperature of their homes at an unsafe level (50–64 cohort: 20% vs. 31%; 65+ cohort: 14% vs. 33%, respectively).
- Additionally, among those 65 years of age and older, the proportion of Black and Hispanic LGBT people who reported living in poverty, being food insecure, having trouble paying bills, expenses, and rent were about twice that of White LGBT people.
Health and Well-Being
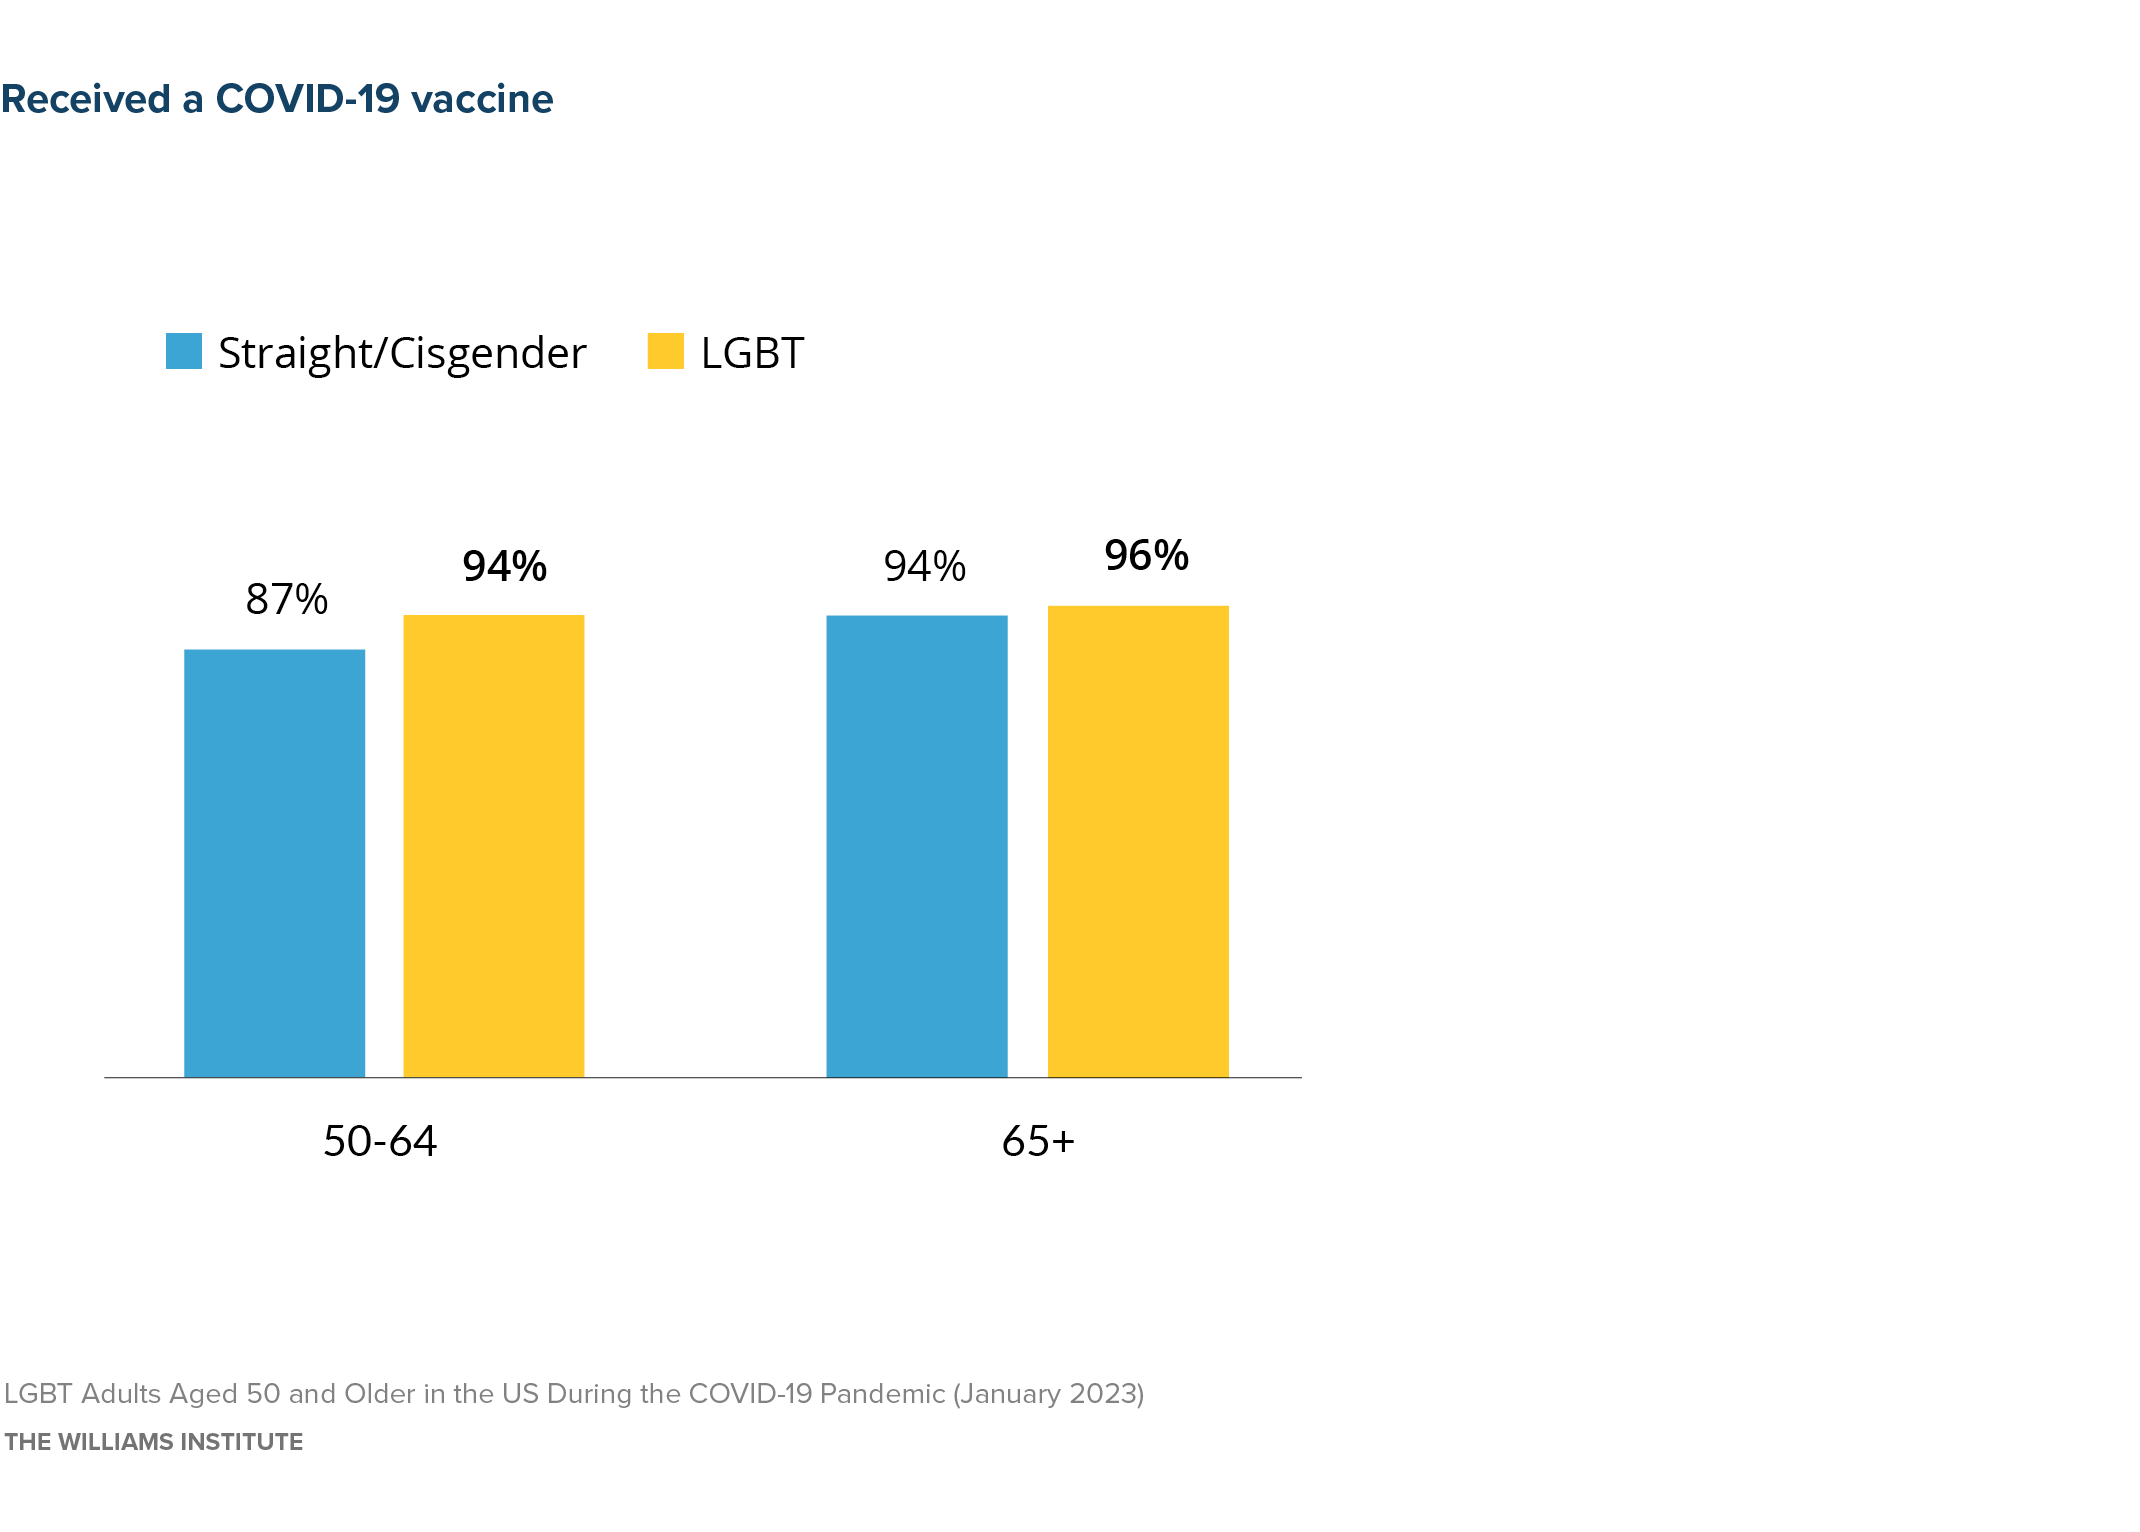
Source: U.S. Census Household Pulse Survey (July 2021–October 2021)
Note: Bolded values indicate LGBT people are statistically different from straight/cisgender people.
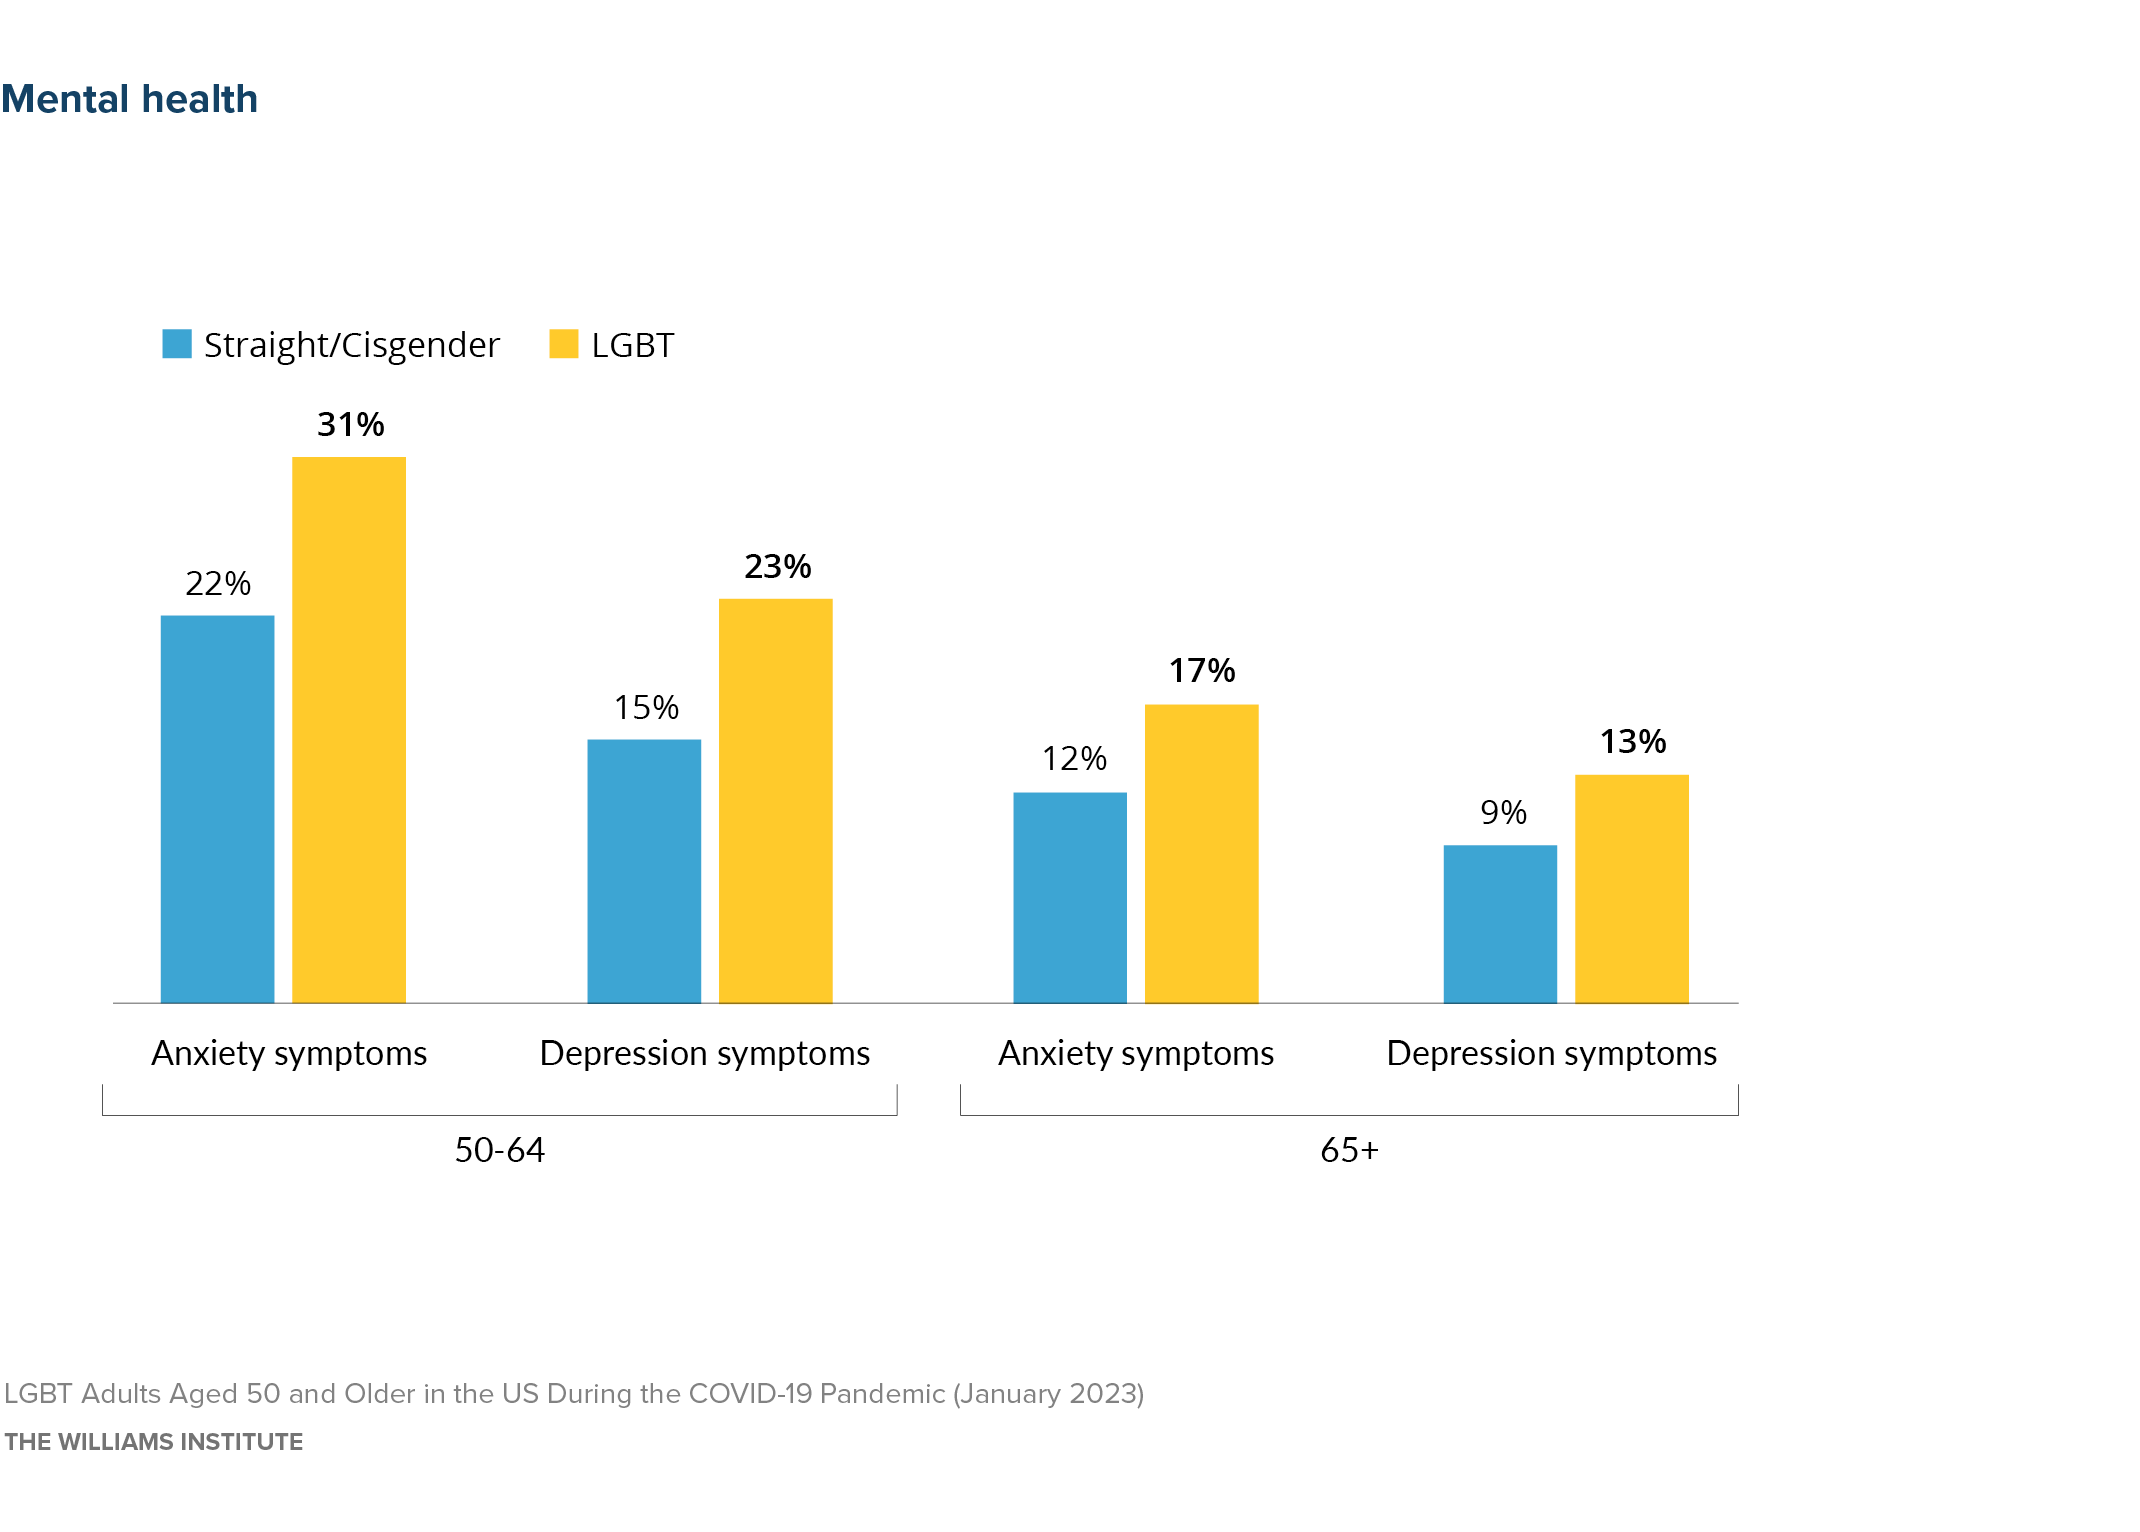
Source: U.S. Census Household Pulse Survey (July 2021–August 2022)
Note: Bolded values indicate LGBT people are statistically different from straight/cisgender people.
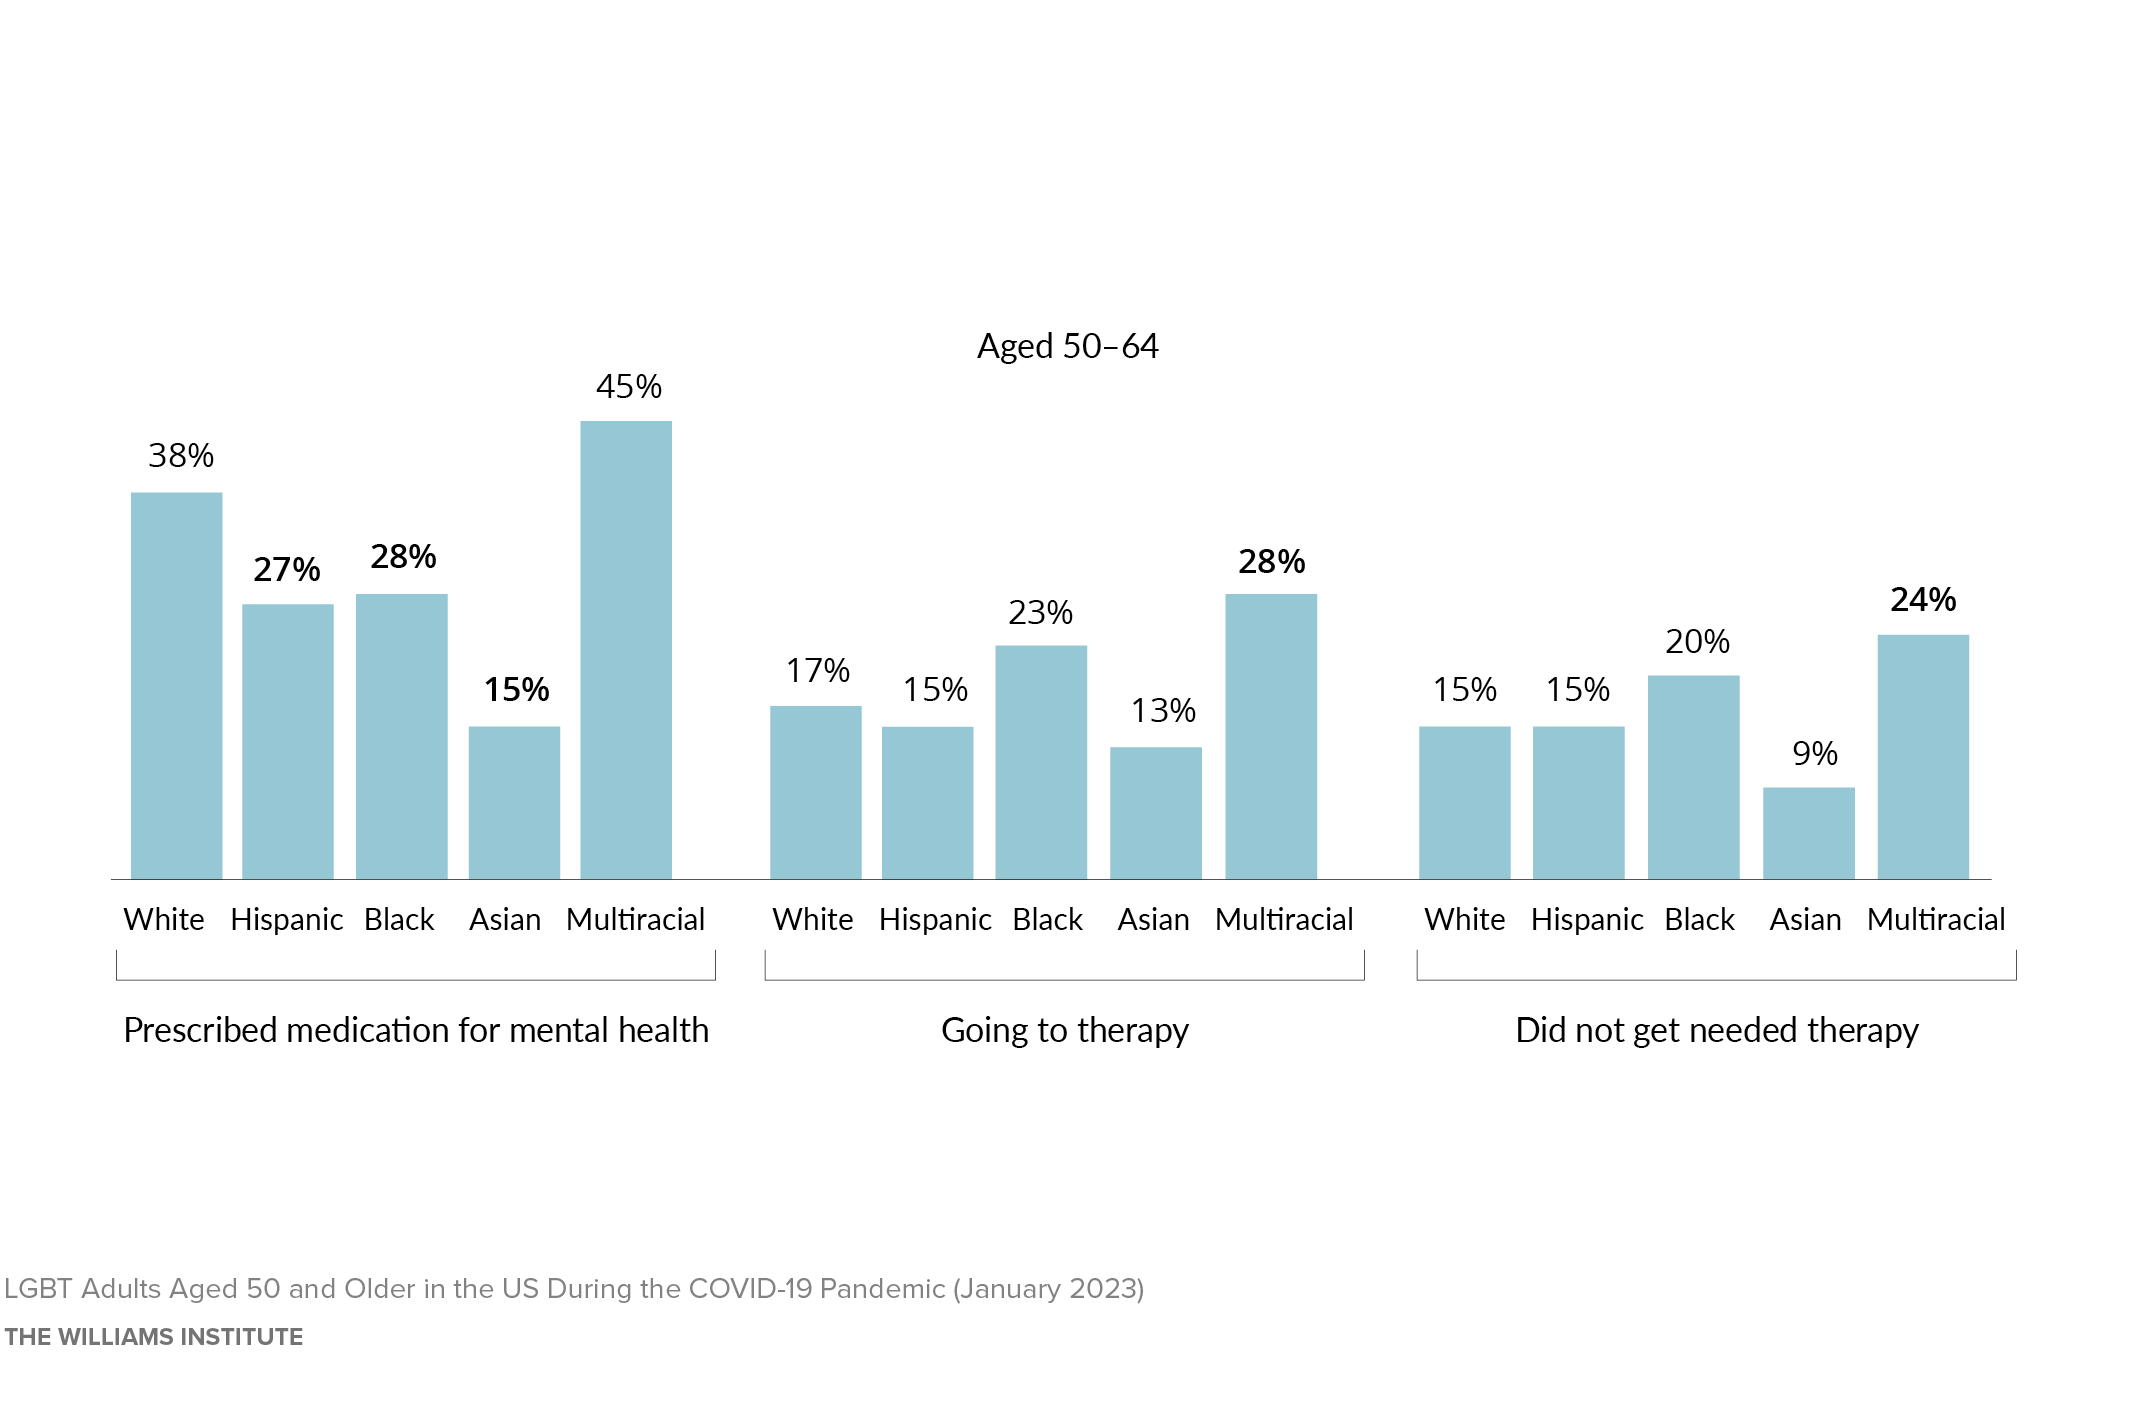
Source: U.S. Census Household Pulse Survey (July 2021–August 2022)
Note: Bolded values indicate that race/ethnicity is statistically different from White.
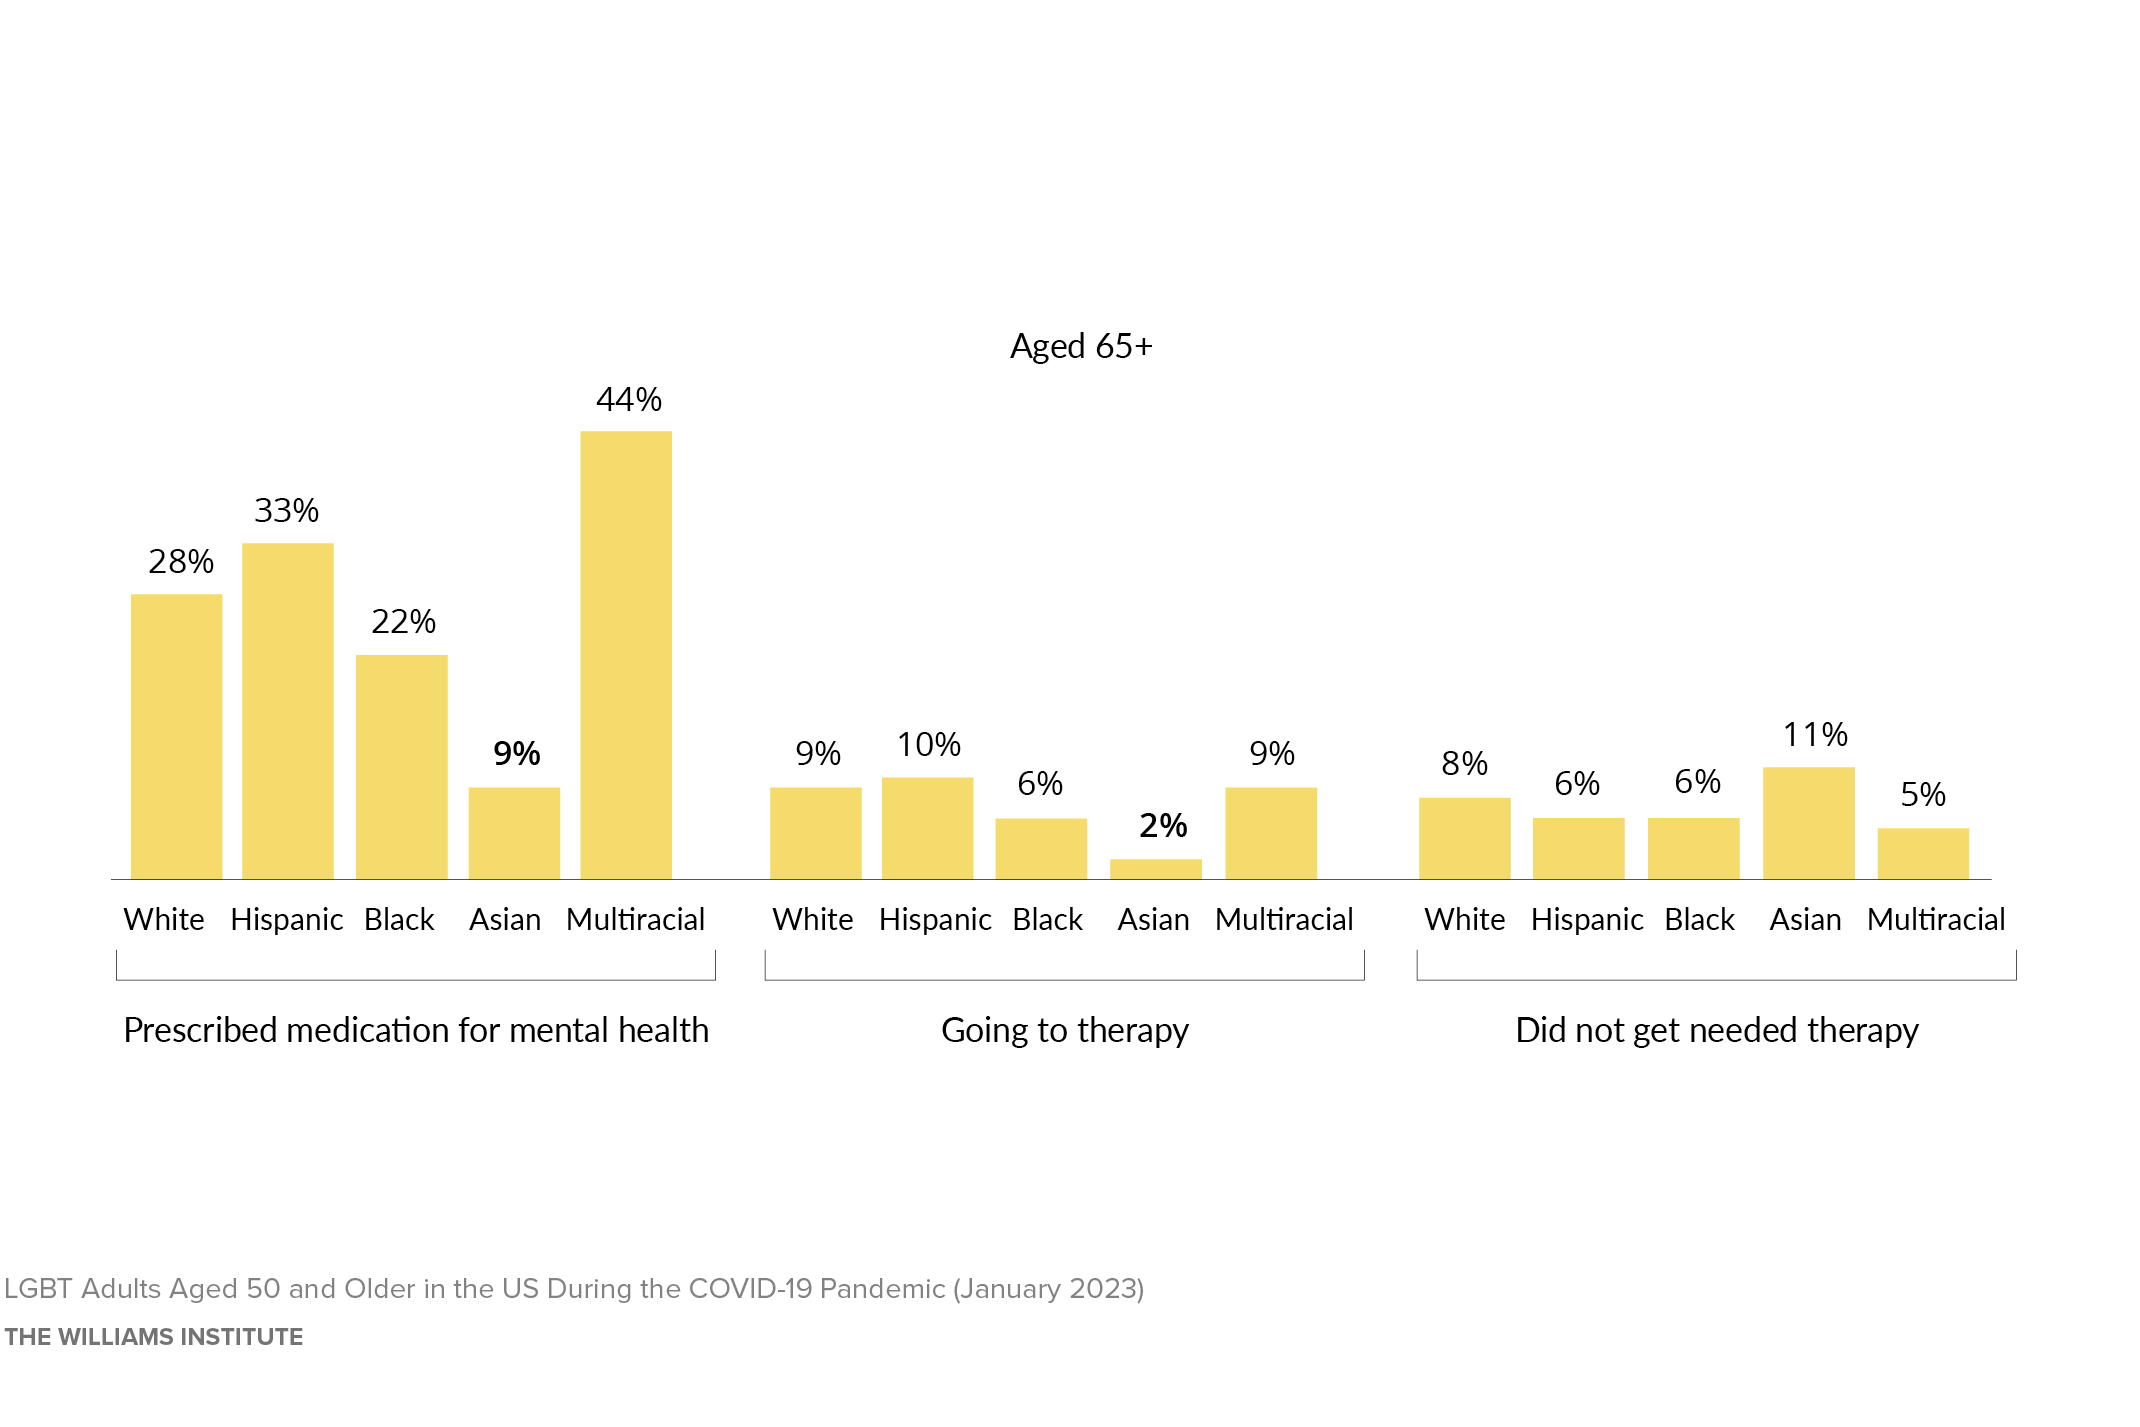
Source: U.S. Census Household Pulse Survey (July 2021–August 2022)
Note: Bolded values indicate that race/ethnicity is statistically different from White and Black.