Executive Summary
As of fall 2019, over 11 million undergraduate and 3 million graduate students were enrolled in four-year or graduate universities. These institutions provide an important stepping stone to higher earnings and greater economic stability; those with higher levels of education are consistently found to have higher rates of employment and higher median earnings. However, LGBTQ undergraduate and graduate students may face unique adversities in university settings relative to their non-LGBTQ counterparts.
This study provides new information about the experiences of LGBTQ people who have attended four-year college or graduate school using data collected for the nationally representative Access to Higher Education Survey. Information about campus climate, experiences of belonging, discrimination, violence, mental health, educational aspirations, and sources of financial support were explored for LGBTQ and non-LGBTQ people ages 18 to 40, including 629 respondents who have attended four-year college and 193 respondents who have attended graduate school.
Four-Year College
Nearly three in five (58.3%) LGBTQ people ages 18-40 reported that they had attended four-year college at some point in their lives. Most (61.8%) attended public four-year institutions. Of LGBTQ people who attended college, 25.8% were current college students and 55.9% had completed their bachelor’s degree. Two in five (44.4%) reported that while in college they aspired to obtain more education (e.g., a graduate degree).
LGBTQ people were four times more likely to report having picked a university in a different city or state to seek a more welcoming climate than non-LGBTQ people (21.5% vs. 4.8%, respectively). Twice as many LGBTQ people picked a college elsewhere to get away from family as did their non-LGBTQ counterparts (32.6% vs. 14.1%, respectively).
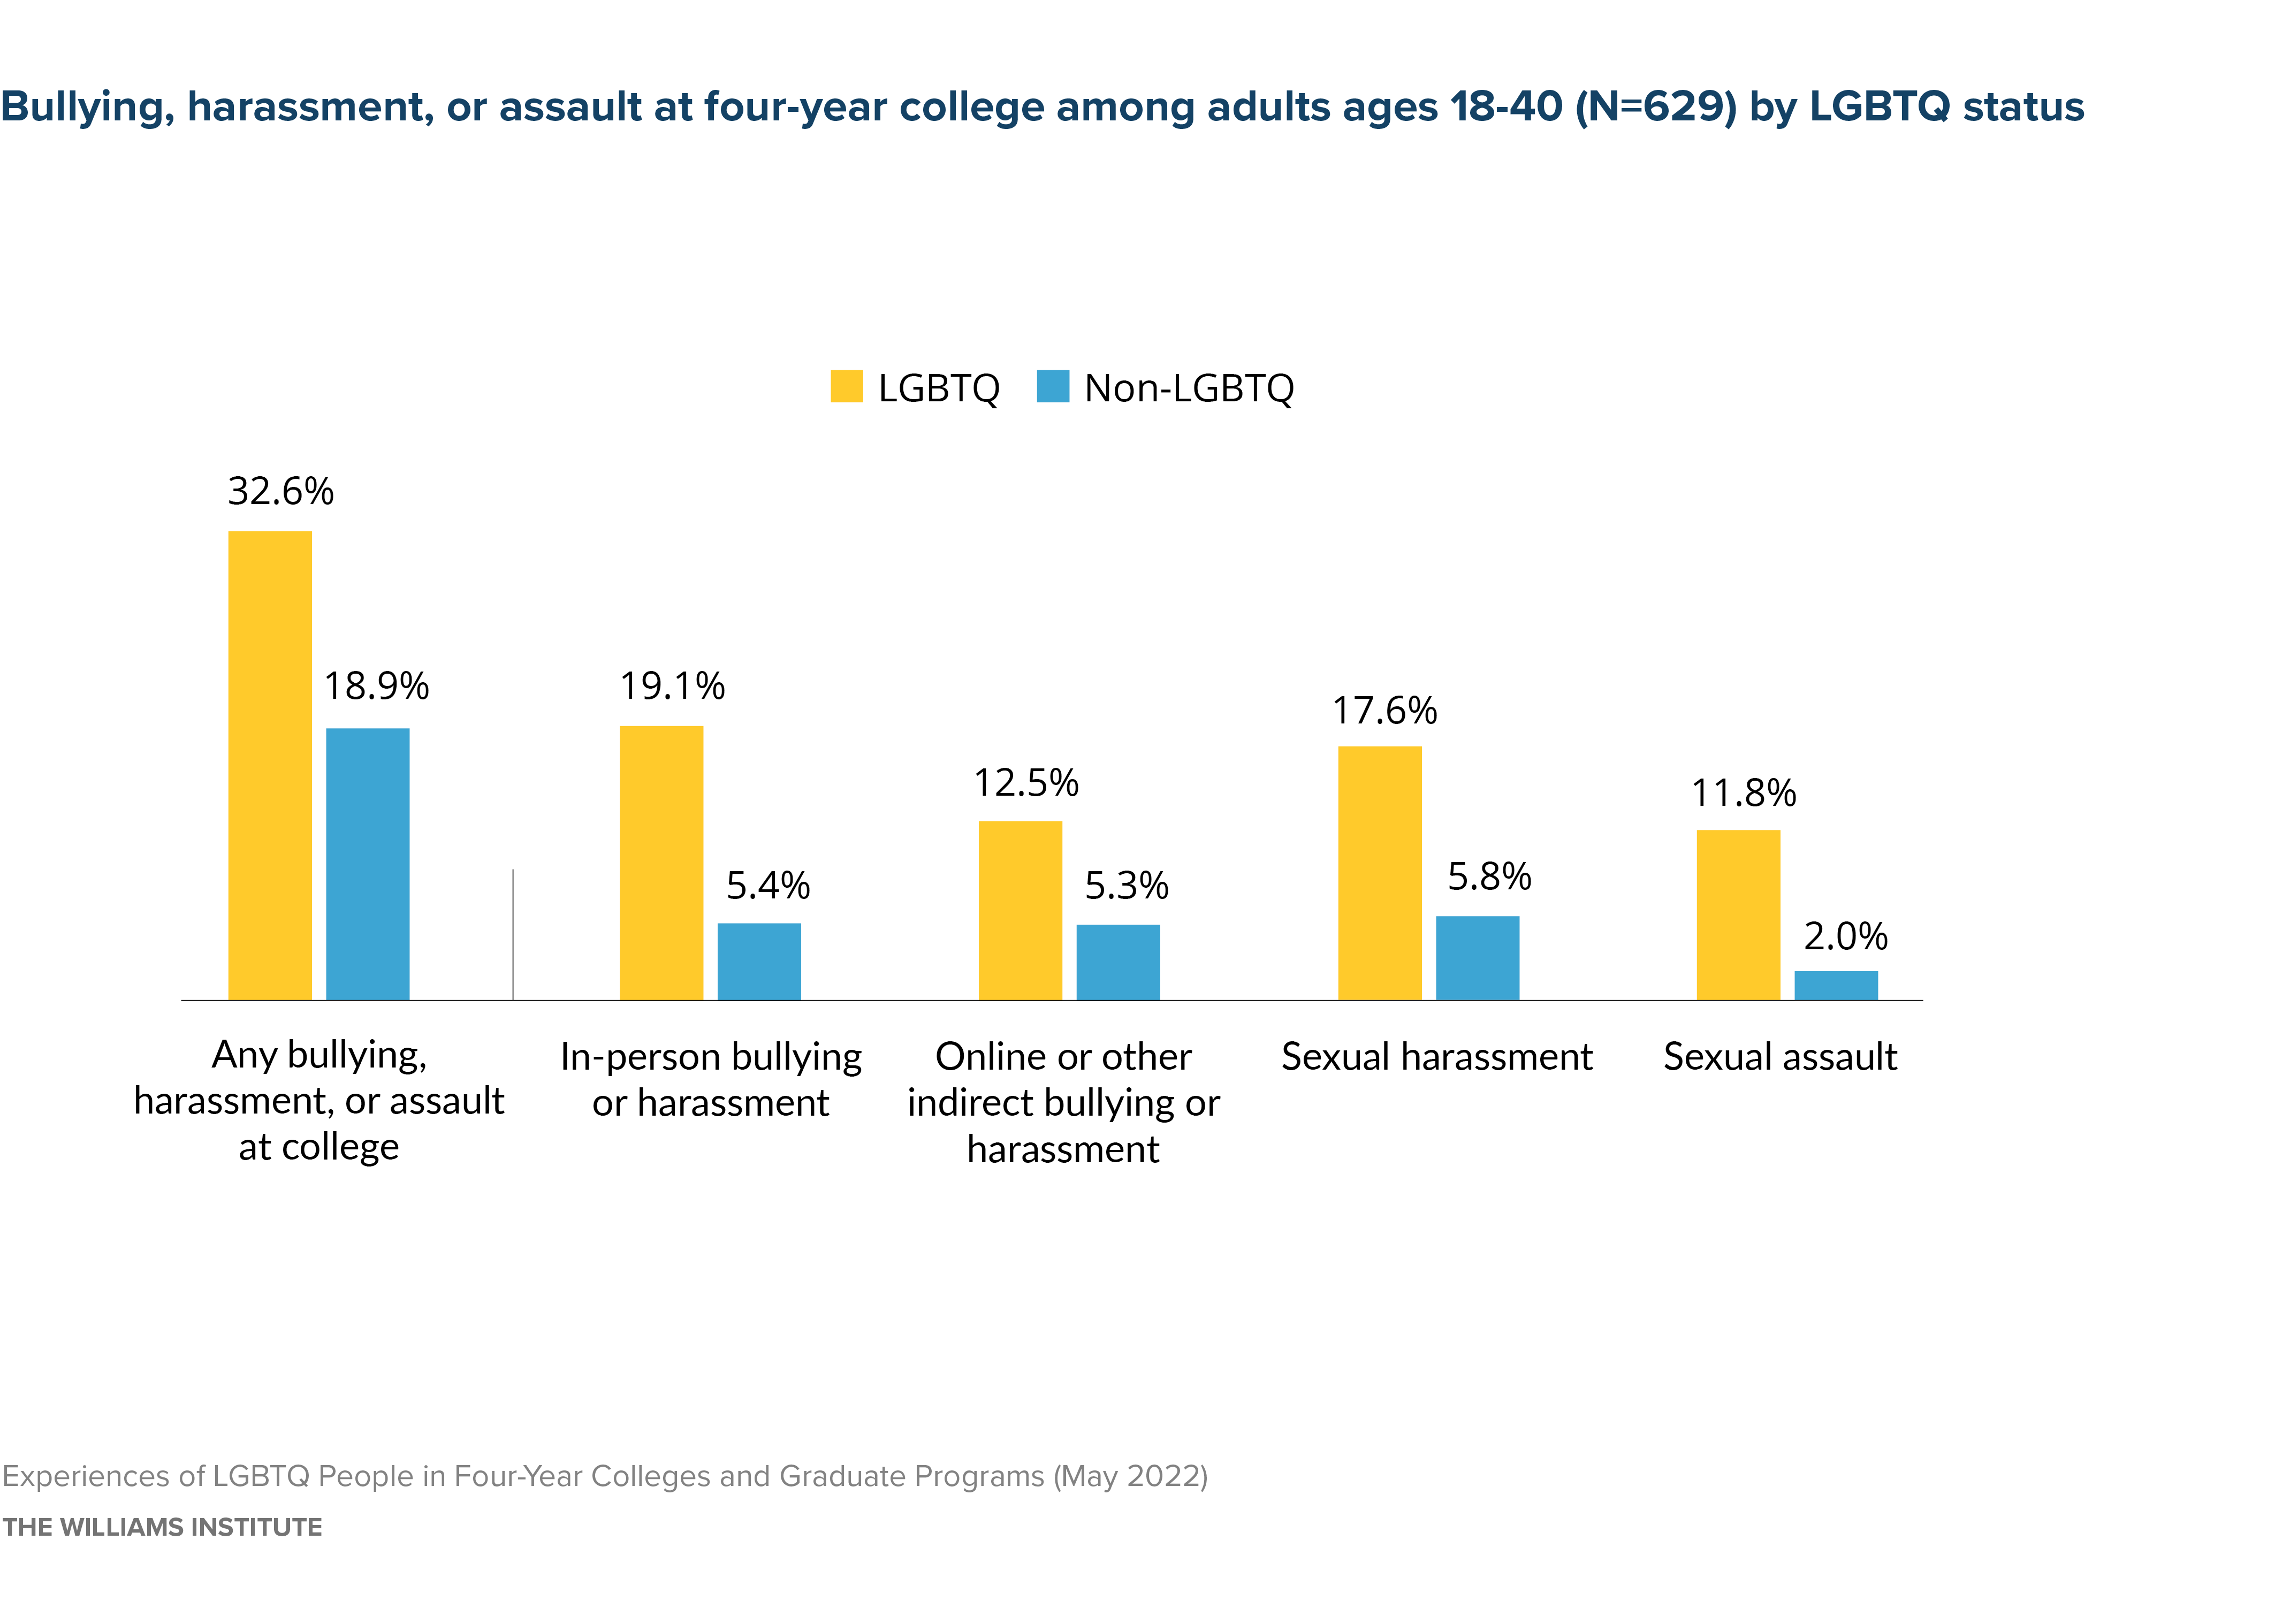
Nearly one-third of LGBTQ people (32.6%) experienced bullying, harassment, or assault at college, compared to 18.9% of non-LGBTQ people. Specific forms of adversity were experienced by twice as many or more LGBTQ than non-LGBTQ people. Nearly one in five (19.1%) LGBTQ people experienced in-person bullying or harassment, 12.5% of LGBTQ people experienced online or other indirect bullying or harassment, 17.6% experienced sexual harassment, and 11.8% experienced sexual assault in college. Each of these was reported by fewer non-LGBTQ people, including in-person bullying or harassment (5.4%), online or other indirect bullying or harassment (5.3%), sexual harassment (5.8%), or sexual assault (2.0%). Other students were the most frequently identified perpetrators of bullying, harassment, or assault of LGBTQ and non-LGBTQ people.
Nearly three-quarters of LGBTQ and non-LGBTQ people who had experienced bullying, harassment, or assault at their college said that their college did not know that the bullying, harassment, or assault was happening. Among the LGBTQ people who were victimized, only 19.5% said that their college had an easily accessible, visible, and known procedure for reporting LGBTQ-related bias incidents and hate crimes that is distinct from generic reporting procedures. Few LGBTQ and non-LGBTQ people who experienced bullying, harassment, or assault filed a report or formal complaint.
LGBTQ people were more likely to have lived in campus housing while attending college (59.5% vs. 46.4%) and were more likely than non-LGBTQ people to have experienced bullying, harassment, or assault while living in campus housing (25.2% vs. 11.3%). LGBTQ people in campus housing were more likely to experience online or other indirect bullying or harassment (6.7% vs 1.9%), sexual harassment (6.8% vs. 1.2%), and sexual assault (8.0% vs. 1.0%). Additionally, LGBTQ people were more likely to report unfair treatment from residence life staff (5.5% vs. 0.8%) and hearing slurs or negative comments about LGBTQ people while in campus housing (38.0% vs. 14.1%) than their non-LGBTQ peers.
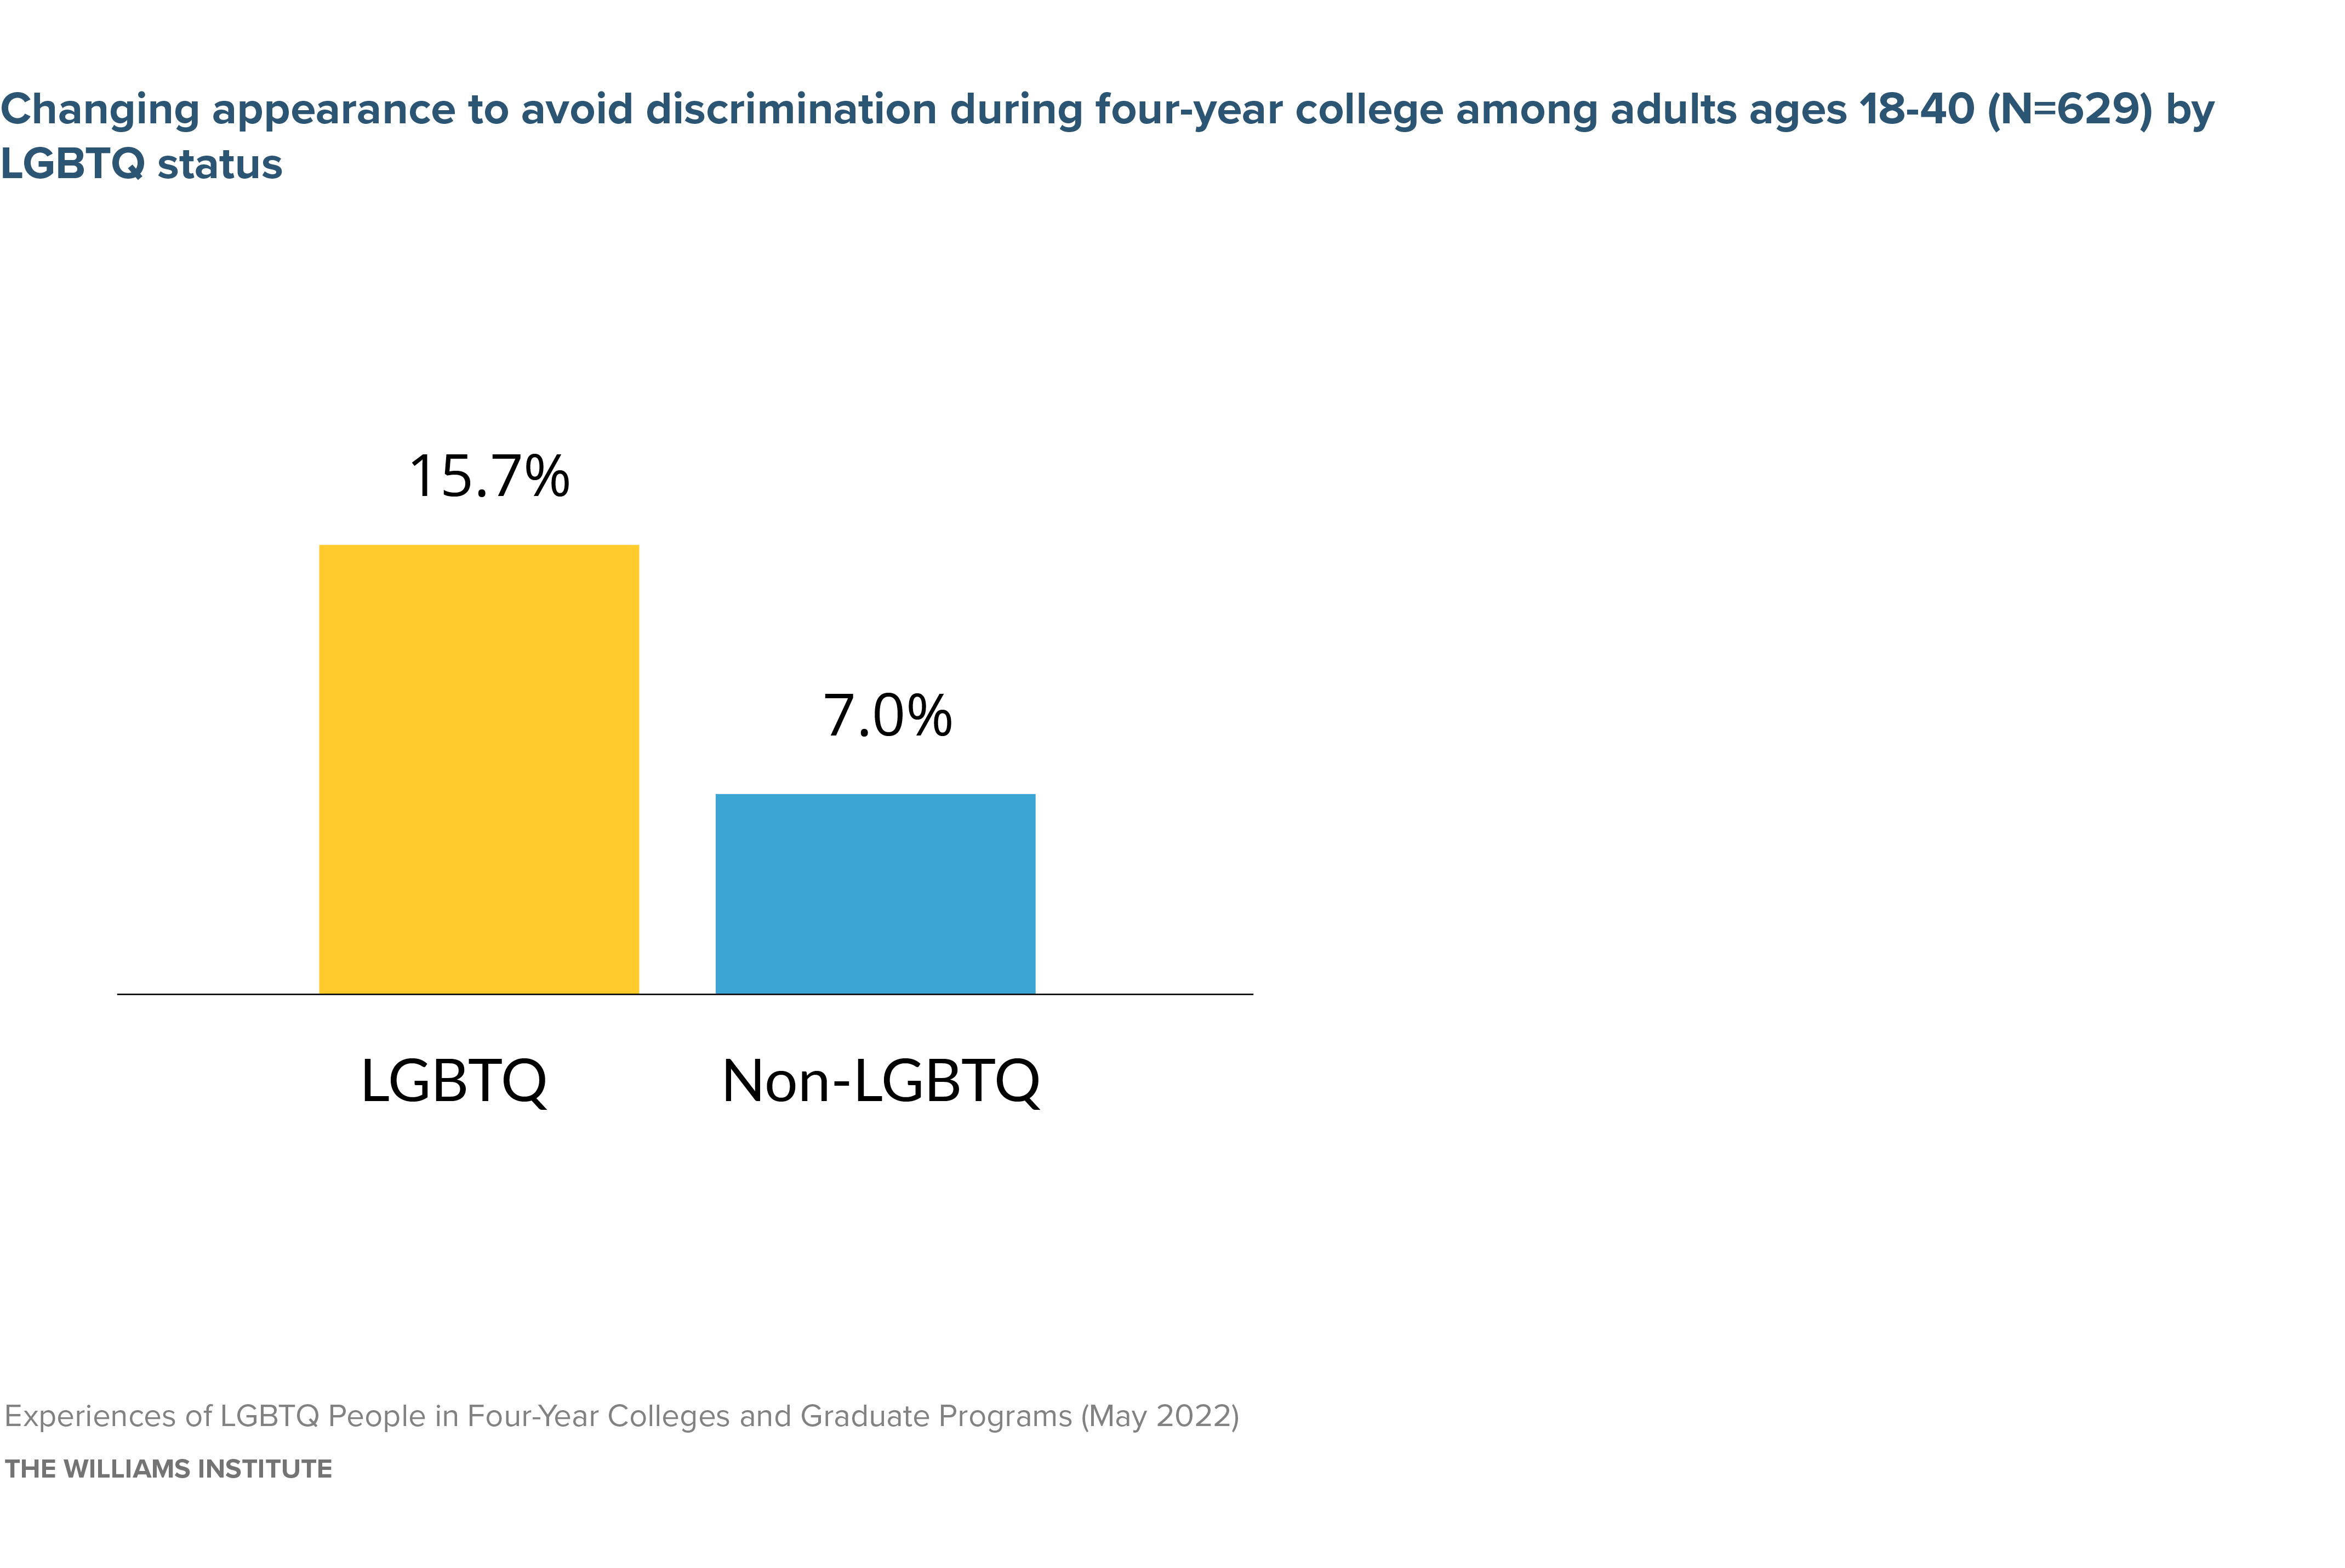
LGBTQ people were more than twice as likely to have changed their dress, appearance, or mannerisms to avoid discrimination at college compared to non-LGBTQ peers (15.7% and 7.0%, respectively).
In general, more LGBTQ than non-LGBTQ people reported the presence of LGBTQ resources and indicators of LGBTQ-inclusion at their colleges, including symbols in campus buildings, resources for LGBTQ people, “out” teachers, staff, or administrators, or gender-inclusive policies. Over three-quarters (78.8%) of LGBTQ people and over half (55.4%) of non-LGBTQ people reported that their college had a LGBTQ student organization. Slightly more than half (51.7%) of LGBTQ people and 40.3% of non-LGBTQ people reported that their school had a LGBTQ student resource center.
Resources specific to transgender students were reported less often than other LGBTQ resources— including the presence of at least one gender neutral bathroom at their four-year college (noted by 44.4% of LGBTQ and 20.9% of non-LGBTQ people) and a policy of allowing transgender students to change their gender designation on their program records or documents (noted by 25.0% of LGBTQ and 11.0% of non-LGBTQ people). Less than a third (29.3%) of LGBTQ people and less than one in five (17.5%) non-LGBTQ people reported that their college had gender-inclusive housing.
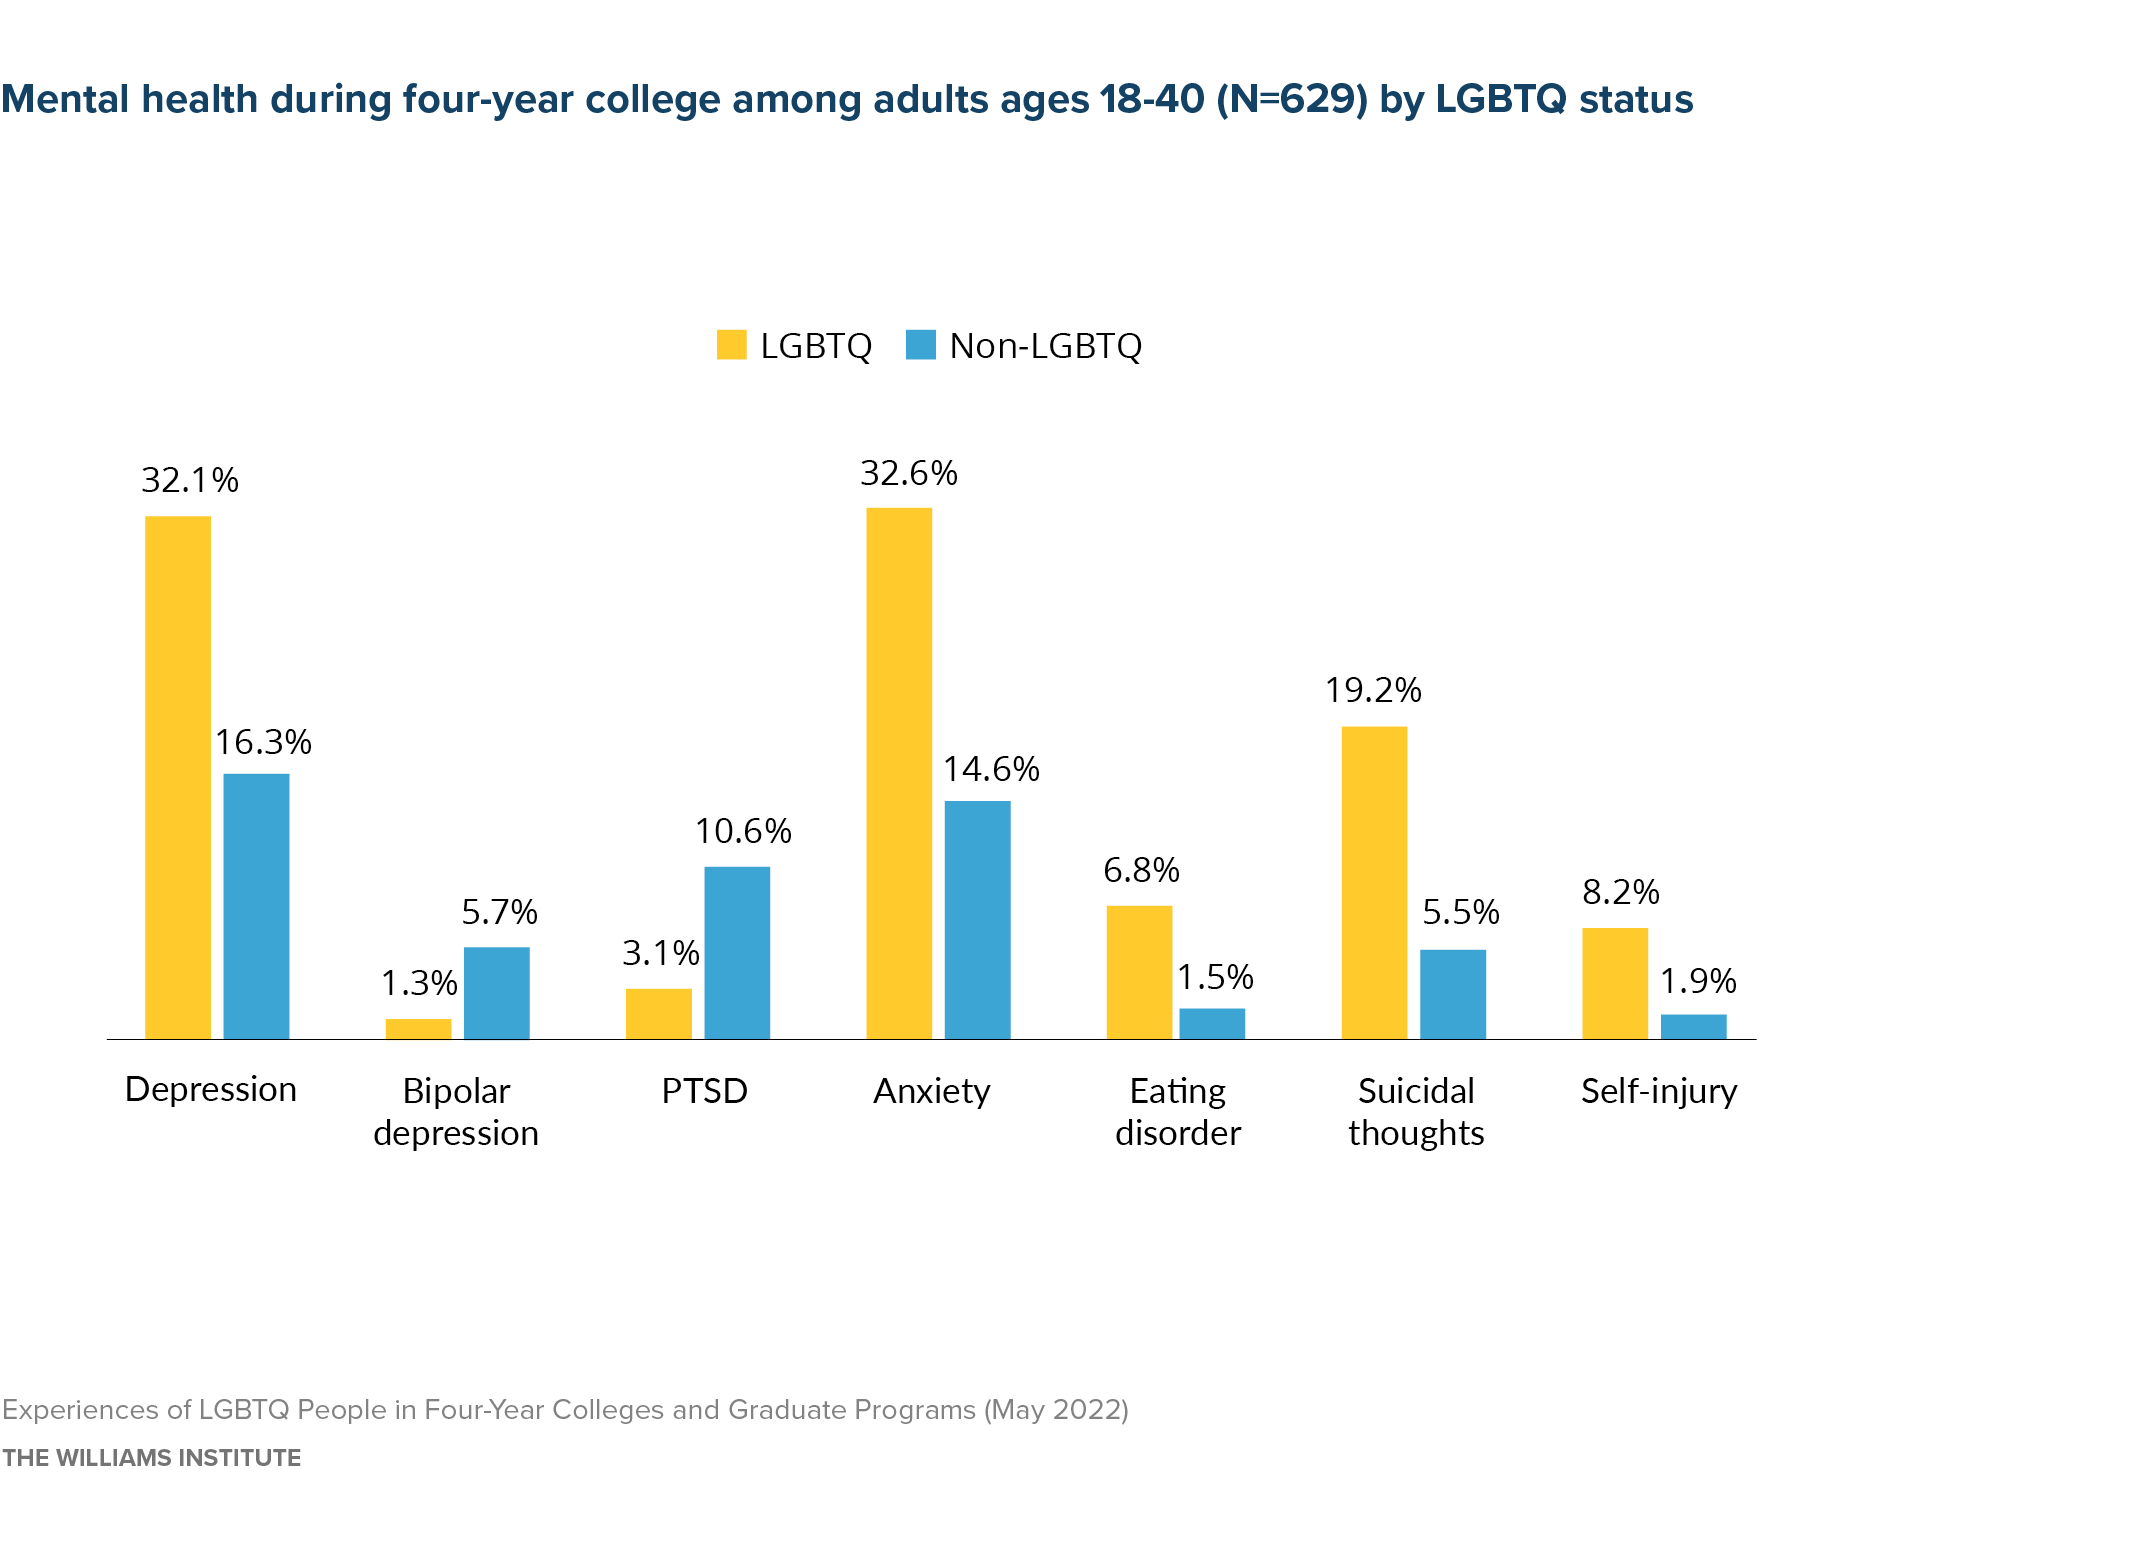
Fewer LGBTQ people experienced a sense of belonging at their college (71.9%) compared to non- LGBTQ people (83.5%). Additionally, more LGBTQ people reported mental health struggles while in college than their non-LGBTQ peers. LGBTQ people were about three times more likely as non-LGBTQ people to report that their mental health was not good all or most of the time they were in college (35.3% and 10.8%, respectively). LGBTQ people were also at least twice as likely as non-LGBTQ people to report that a professional told them that they had a specific mental health problem while in college, including depression (32.1% vs. 16.3%), bipolar depression (5.7% vs. 1.3%), PTSD (10.6% vs. 3.1%), anxiety (32.6% vs. 14.6%), an eating disorder (6.8% vs. 1.5%), suicidal thoughts (19.2% vs. 5.5%), or self-injury (8.2% vs 1.9%).
A minority of LGBTQ people reported that their colleges had LGBTQ-supportive counseling services (38.5%) or LGBTQ-informed health services (29.5%).
Graduate School
Roughly one in ten (11.1%) LGBTQ people ages 18-40 reported that they attended graduate school at some point in their lives. About half (54.2%) of these attended graduate programs at public universities. Two-thirds (66.7%) of those who have attended graduate school had completed a graduate degree at the time of survey completion and 30.4% were current students. Among both LGBTQ and non-LGBTQ people, more than half of current graduate students were pursuing a master’s degree, about a quarter was pursuing doctoral degrees, and about one in ten were pursing professional degrees (e.g., law, medicine). Among those that have completed a graduate degree, about four-fifths had completed a master’s degree (80.9%).
LGBTQ people were much more likely to report having picked a university in a different city or state to seek a more welcoming climate, or to get away from family than non-LGBTQ people. An estimated 18.1% of LGBTQ people compared to 3.0% of non-LGBTQ people said they picked a graduate school elsewhere because they thought it would be more welcoming of someone like them. A quarter (25.5%) of LGBTQ people compared to 2.1% of non-LGBTQ people picked a graduate school elsewhere to get away from family. While in graduate school, LGBTQ people were less likely to report support from family resources for their educational expenses than non-LGBTQ people (28.1% and 53.0%, respectively).
About two-thirds or more of LGBTQ people who attended graduate school reported that faculty and school staff and students at their graduate programs were very accepting of LGBTQ people. 70.8% and 64.5%, respectively. However, about a quarter (25.7%) of LGBTQ people reported hearing slurs or negative comments about LGBTQ people at their school. And, more than one in ten (11.6%) LGBTQ people changed their dress, appearance, or mannerisms to avoid discrimination at graduate school— far more than their non-LGBTQ peers (1.5%).

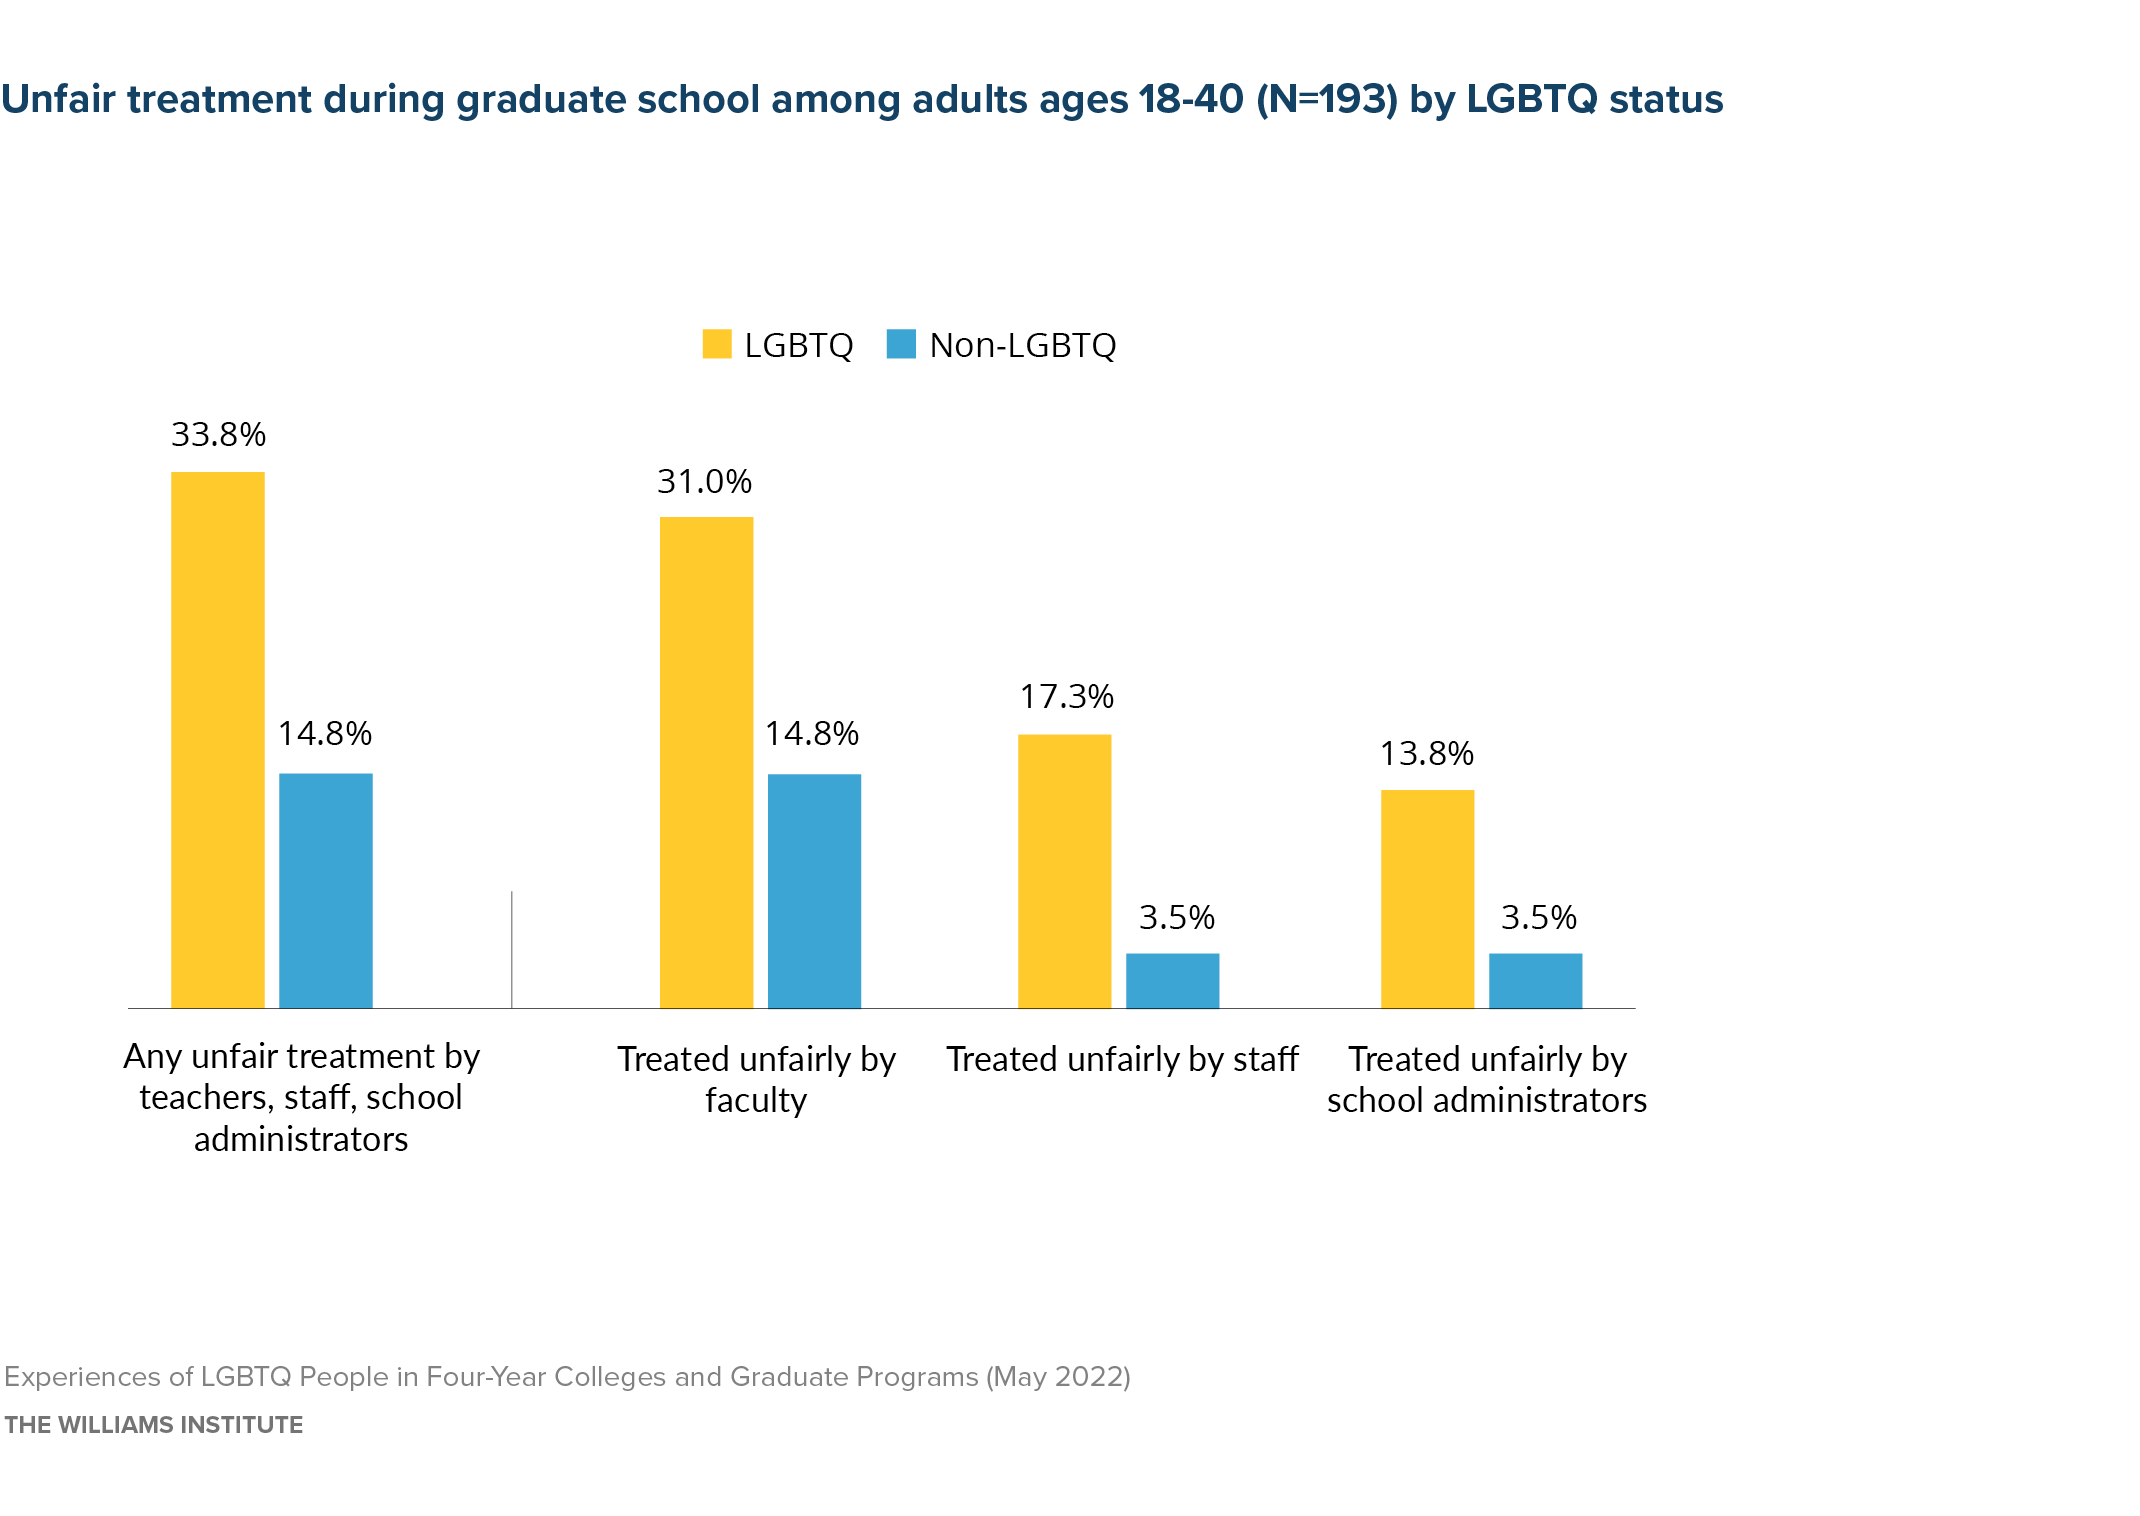
LGBTQ people were more than twice as likely to report unfair treatment by faculty, staff, or school administrators, compared to non-LGBTQ people (33.8% and 14.8%, respectively). Almost a third (31.0%) of LGBTQ people reported unfair treatment by faculty, compared to 14.8% of non-LGBTQ people. LGBTQ people were also more likely to report unfair treatment by staff (17.3% vs. 3.5%) and by school administrators (13.8% vs. 3.5) in graduate programs.
LGBTQ and non-LGBTQ people experienced bullying, harassment, and assault in graduate school at statistically similar rates, with 19.5% of LGBTQ and 9.1% of non-LGBTQ people reporting such victimization.
LGBTQ people were more likely to report that their graduate school had LGBTQ resources and indicators of LGBTQ-inclusion than non-LGBTQ people. Across LGBTQ and non-LGBTQ groups, a LGBTQ student organization was the most common resource, with three-quarters (76.1%) of LGBTQ people and half (51.5%) of non-LGBTQ people that their school had this resource. Among LGBTQ people, half or more reported that their graduate school had a LGBTQ student resource center (52.0%), “out” LGBTQ teachers, staff, or administrators (64.3%), LGBTQ symbols in campus buildings (59.2%), or integration of LGBTQ issues into existing courses (57.9%).
Among LGBTQ people, resources specific to transgender students were somewhat less commonly noted than general LGBTQ resources, including the presence of at least one gender neutral bathroom (48.0%) and a policy of allowing transgender students to change their gender markers on their school records (32.0%) with more than half, 57.9%, unaware of such policies). Less than a quarter (22.2%) of LGBTQ people reported that their graduate school had gender-inclusive housing.
While most (75.0%) LGBTQ and non-LGBTQ graduate students felt a sense of belonging at their graduate school, fewer LGBTQ than non-LGBTQ people felt that faculty empowered them to learn (80.9% vs. 92.5%), and fewer would recommend their graduate school to others (73.1% vs. 88.6%).
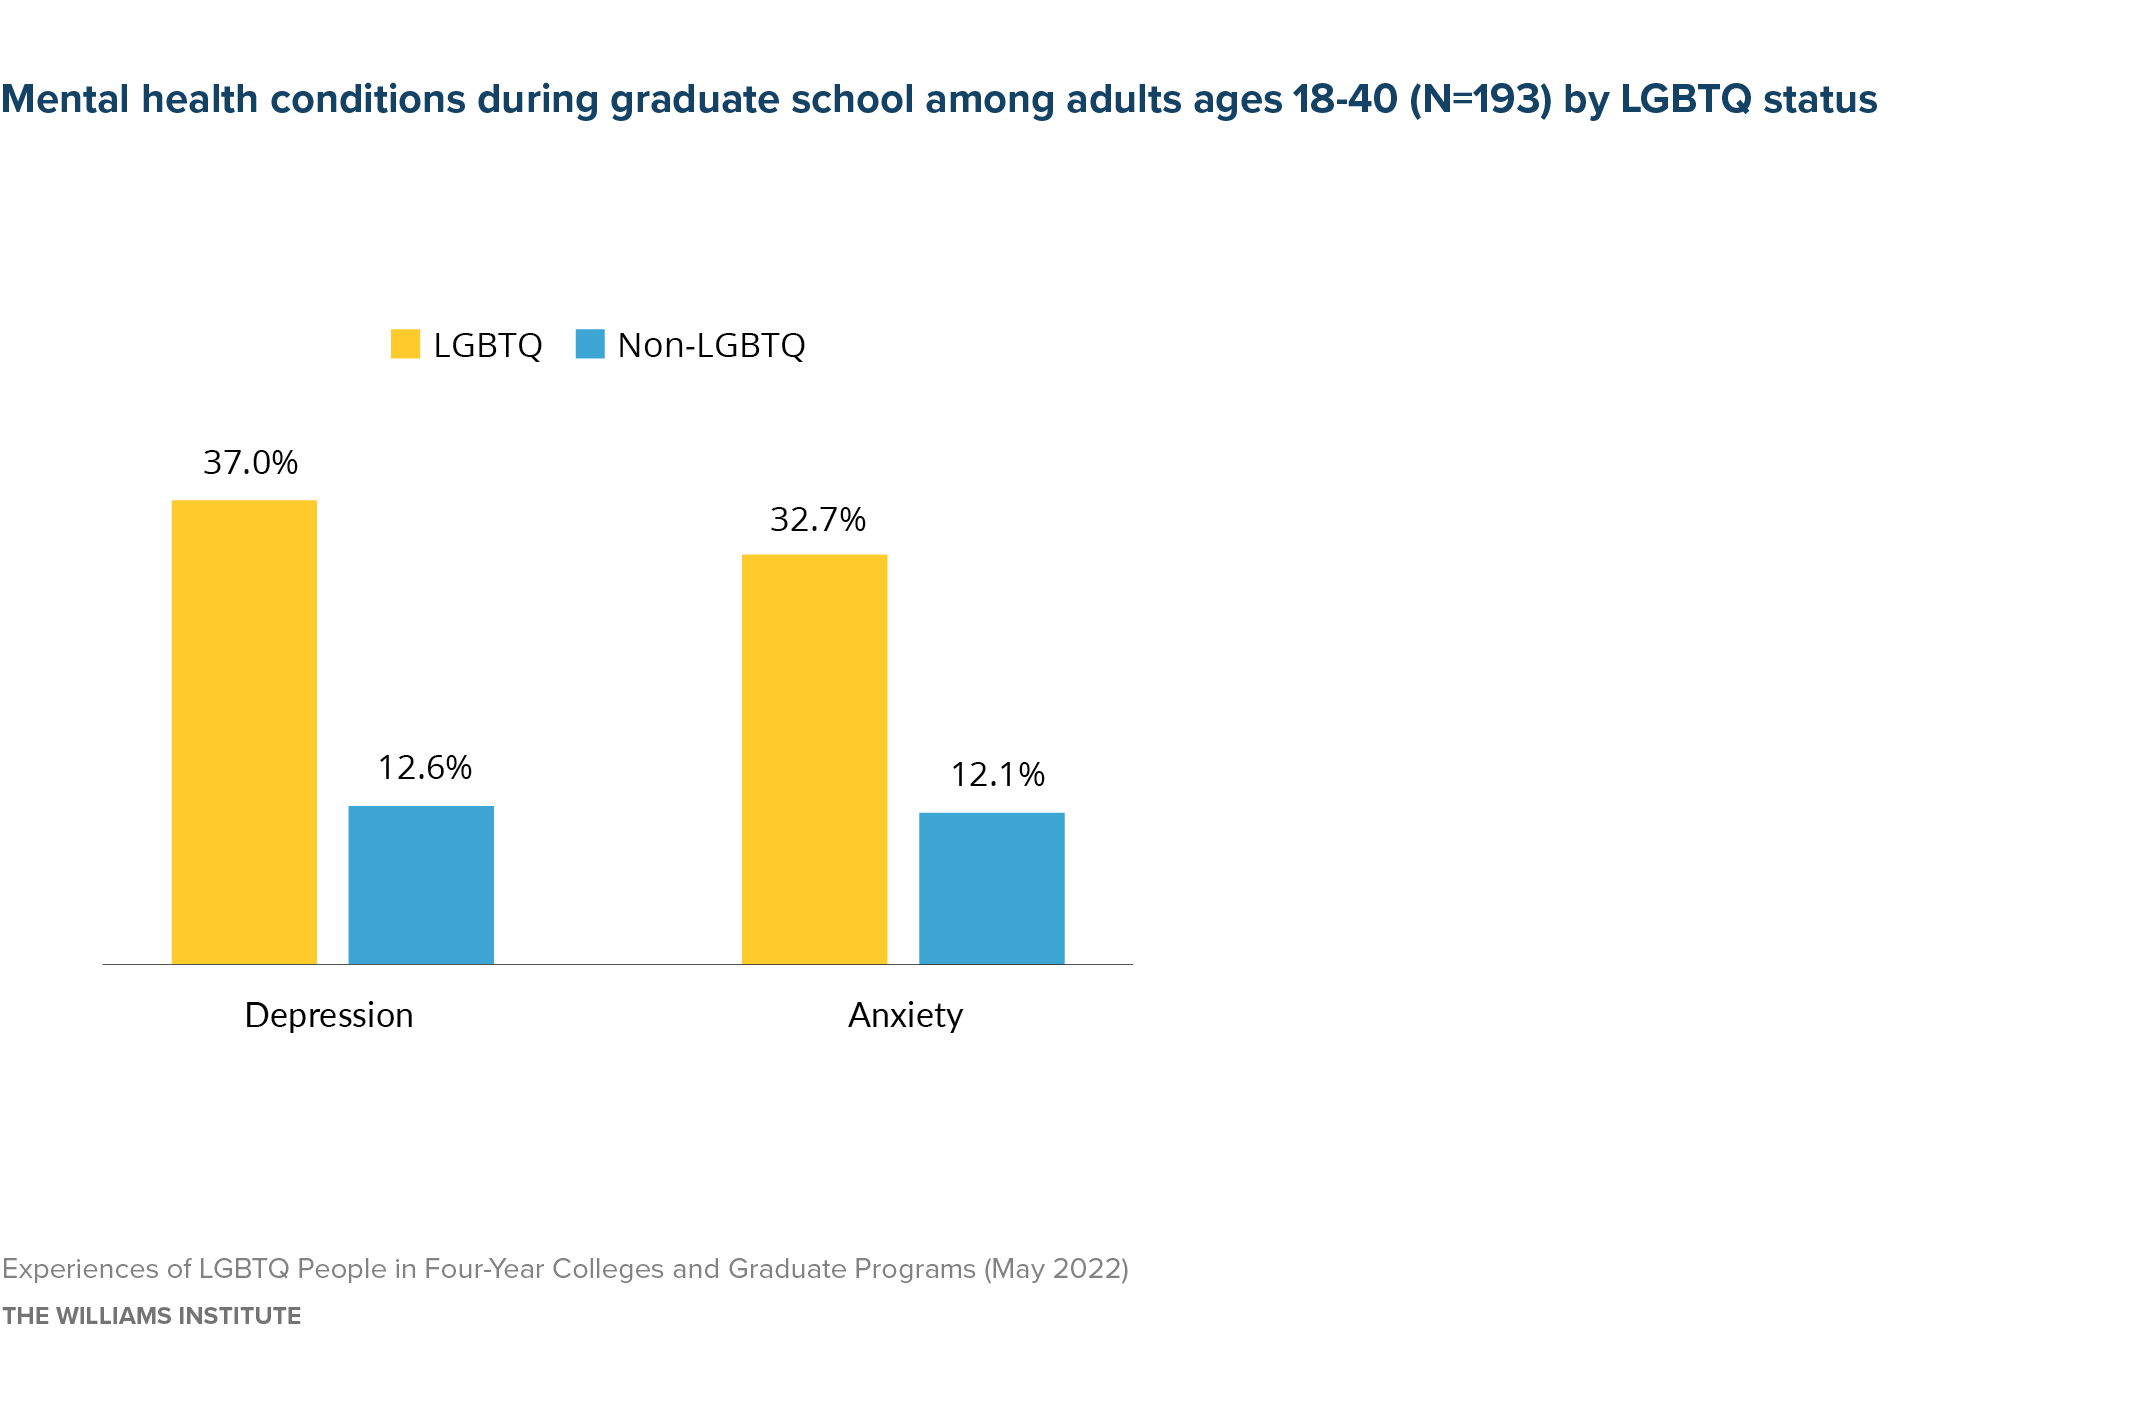
Moreover, more LGBTQ people reported mental health struggles while in graduate school than their non-LGBTQ peers. LGBTQ people were nearly four times more likely than non-LGBTQ people to report that their mental health was not good all or most of the time they were in graduate school (34.1% and 8.6%, respectively). LGBTQ people were at least twice as likely as non-LGBTQ people to report that a professional told them that they had some specific mental health problems while in graduate school, including depression (37.0% vs 12.6%) and anxiety (32.7% vs. 12.1%).
Less than half of LGBTQ people reported that their graduate school had LGBTQ-supportive counseling services (46.2%) or LGBTQ-informed health services (39.9%).
Download the full report