Introduction
Throughout the last two decades, voter exit polls have consistently shown that lesbian, gay, and bisexual (LGB) voters comprise approximately 3-5% of the electorate and overwhelmingly support Democratic candidates. In analyses of data collected from January-June 2014, Gallup found that 63% of LGBT adults identify or lean toward identifying as Democrats compared to 44% of their non-LGBT counterparts (Newport 2014).
The ability of LGBT voters to affect the outcome of elections is greatest in very close elections where a Democratic candidate wins by a small margin. For example, analyses of the 2012 presidential election suggested that had LGBT voters not participated in elections in Ohio and Florida (both if which had winning margins by President Obama of less than 2%), Republican presidential candidate Mitt Romney may have defeated the President in those two swing states (Gates 2012).
This research brief analyzes results of the impact of the LGB vote on the 2014 US elections using national congressional exit polling data. The findings suggest that had LGB voters not gone to the polls, Republican rather than Democratic candidates would have been victorious in the Virginia US Senate race and in the Gubernatorial race in Vermont.


The 2014 LGB Electorate
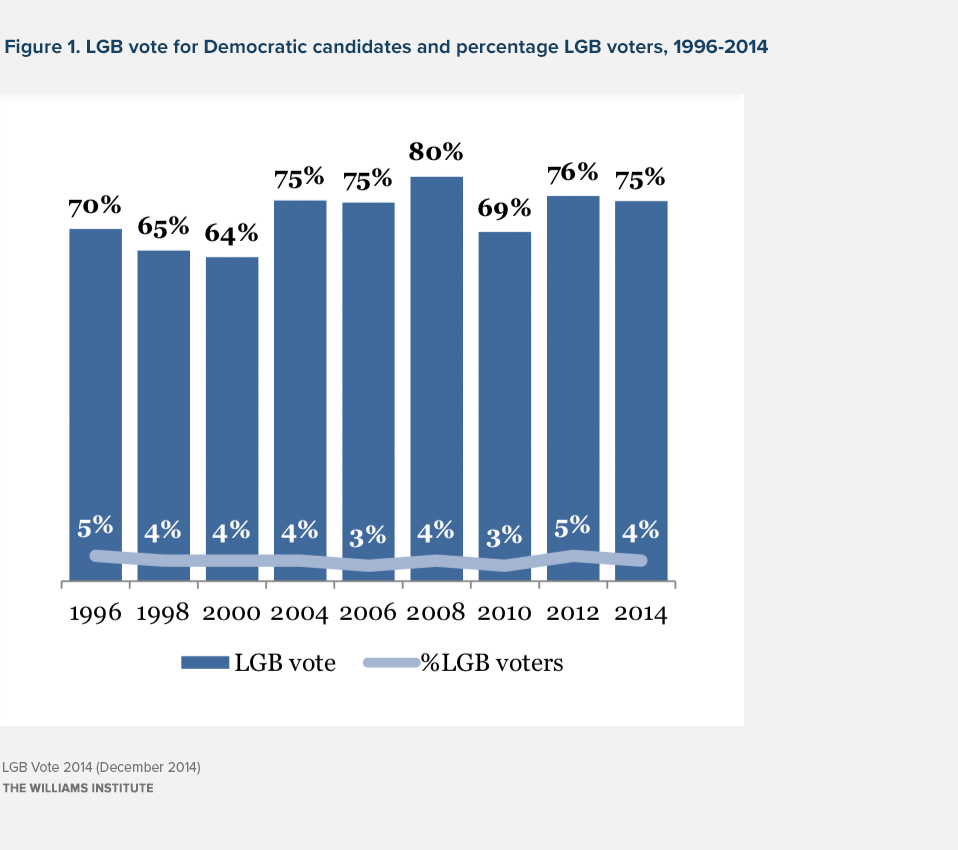
Exit polls from the 2014 US midterm election suggest that 4% of the electorate identified as lesbian, gay, or bisexual. This represents the highest recorded LGB turnout in a midterm election since 1998.
The LGB vote has consistently favored Democratic candidates (see Figure 1). On average over the last two decades, 72% of LGB voter support has gone to Democrats. In the last midterm elections in 2010, the LGB vote was less Democratic than the average at 69%. Findings suggest that this drop in Democratic support was short-lived as exit polls from the 2014 midterm election indicate that 75% of LGB voters supported Democratic congressional candidates.
Unfortunately, direct measurements of state-level LGB voter participation and candidate or party preferences are not available. Instead, the 2014 exit poll data only provide national-level estimates of LGB voter participation and support for the US House of Representatives candidates.
These analyses consider the impact of the LGB vote in state Senate and Gubernatorial elections where the margin of victory for a Democratic candidate was less than the estimated percentage of LGB voters in the election.

Among Senate races, Democratic candidates in New Hampshire and Virginia won by margins that were less than the estimated percentage of LGB voters in those states. The difference between the two top candidates in the Louisiana Senate race was also less than the percentage of LGB voters, though the Louisiana election will ultimately be decided in a runoff between the top two candidates.
Among Gubernatorial races, Democratic candidates in Colorado, Connecticut, and Vermont all won with margins of victory that were less than the percentage of LGB voters.
The analyses assume that the partisan breakdown in the national midterm exit poll (75% Democrat, 24% Republican, 1% Other) for the LGB vote is the same across the states and in both Senate and Gubernatorial races. The portion of LGB voters is varied across states based on an adjustment using data from Gallup that estimates the portion of adults who identify as LGBT in each state.
LGB votes are effectively removed from final tallies to assess if the outcome of particular races would change if LGB voters had not participated in the election. Details of the methodology are described in the Appendix.
The LGB Vote in the Senate Races
Exit polls suggest that LGB individuals comprise a relatively small proportion of the national electorate. As a result, very close elections where margins between winning and losing candidates are less than the total number of LGB voters constitute races where the LGB vote can plausibly affect the outcome of a race.
These analyses consider the three races for U.S. Senate that had the closest vote margins between the two leading candidates: Virginia, New Hampshire, and Louisiana (see Table 1).
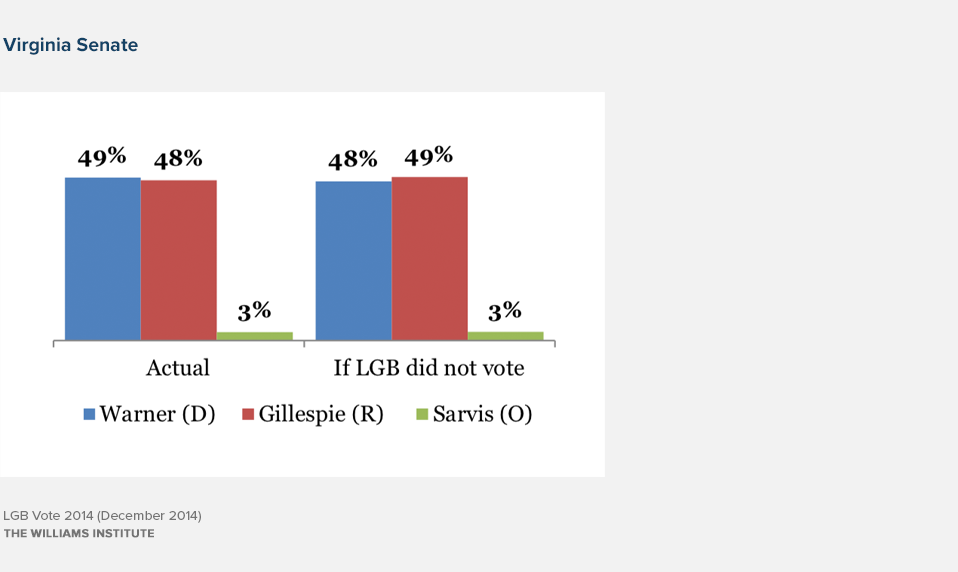
The election was unexpectedly close in Virginia, with the Democratic incumbent Mark Warner winning narrowly over Republican Ed Gillespie by a margin of less than 1% of all votes cast.
Analyses suggest that, without LGB votes heavily favoring Warner, Gillespie would have won by a margin of 1.3% (49.4% to 48.1%). The Virginia Senate seat would have gone to the Republican rather than the Democratic candidate.
Louisiana’s top two candidates will enter a run-off since neither the Democratic incumbent, Mary Landrieu, nor her Republican challenger, Bill Cassidy, received a majority of the vote. As a result, these analyses do not consider if the LGB vote affected who actually takes the Senate seat from Louisiana, but rather the ordering of the two candidates.

In that race, Landrieu garnered 1.1% more of the votes than Cassidy. However, without LGB voters in the race, Cassidy would have garnered an estimated 1.1% more votes than Landrieu.
New Hampshire was also a closely watched race where Democratic incumbent Senator Jeanne Shaheen defeated former Republican US Senator from Massachusetts, Scott Brown, by a narrow 3.2% margin.
Analyses suggest that the results would have been considerably closer if LGB individuals had not voted. Shaheen’s margin of victory would have been an estimated 1%. If LGB voters had not participated in the election in Vermont, it is possible that it would have been close enough to trigger a recount.
The findings suggest that the strong support for Democratic candidates among LGB voters was enough to alter the results of the Virginia Senate race, change the ordering of top candidates in the Louisiana race, and make the New Hampshire Senate race possibly too close to call.
The LGB vote in the Gubernatorial Races
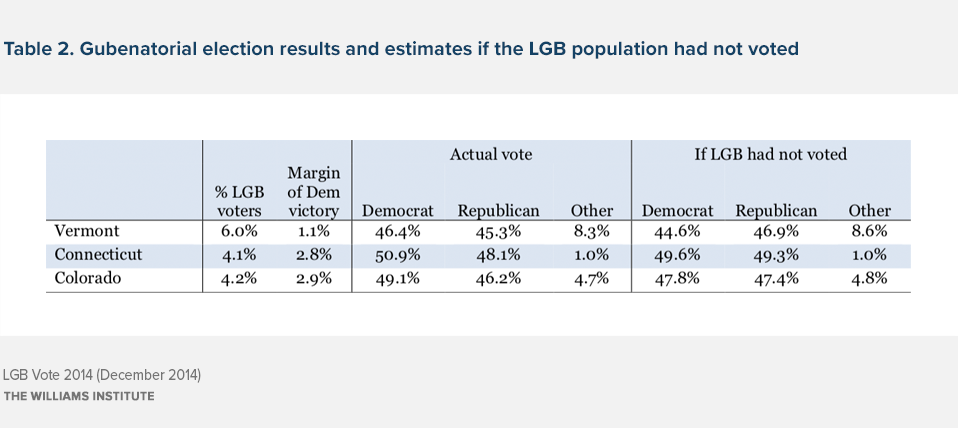
Gubernatorial elections in Vermont, Connecticut, and Colorado were all close enough that the LGB vote may have been decisive in the outcome (see Table 2).
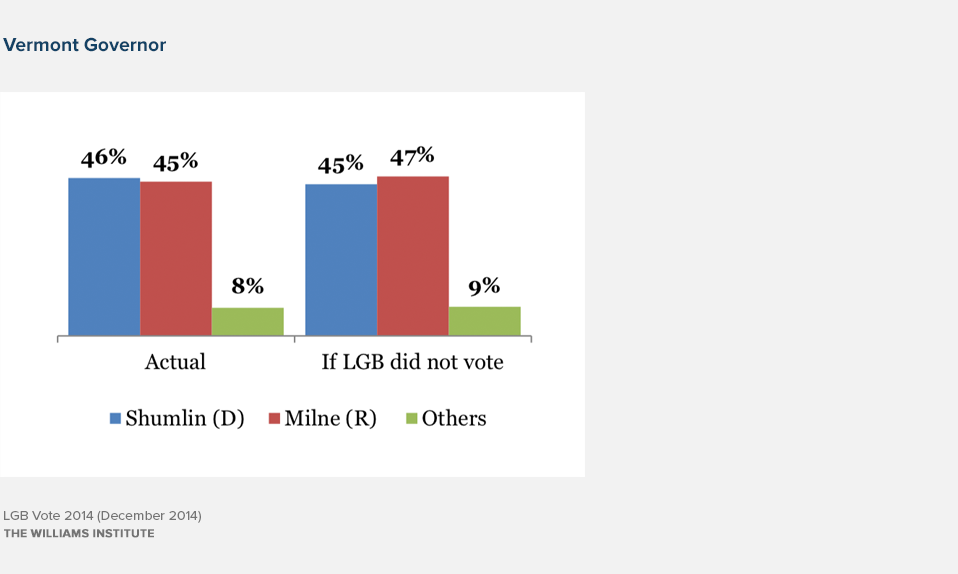
The election in Vermont proved narrow with Democratic incumbent Governor Peter Shumlin reelected by a margin of 1.1% against Republican challenger Scott Milne. Analyses suggest that without the strongly Democratic LGB vote in Vermont, the election would have favored the Republican challenger by a margin of 2.3%.
In Connecticut, Democratic incumbent Governor Dan Malloy won the election over Republican challenger Tom Foley by a thin 2.8% margin. Without the LGB vote, analyses suggest that the margin of victory for the Democratic incumbent would have narrowed to just 0.3%, which would have made the election much closer and potentially subject to a recount.
Colorado’s Democratic incumbent John Hickenlooper was challenged by Republican Bob Beauprez and won by a 2.9% margin. In the absence of LGB voters, estimates suggest that margin would have been only 0.4%, again suggesting the possibility of a recount.
Conclusion
Much of the post-election analyses focused on the wave of Republican wins in the U.S. Senate, U.S. House, and many state Governor races. These analyses suggest that in states where the vote was very close, the LGB vote played a pivotal role.
LGB voters generally comprise about 4% of the electorate and consistently and overwhelmingly support Democratic candidates. Their presence, though a small portion of the population, makes their vote highly consequential in close races. For the 2014 races, the analyses suggest that the LGB vote may have altered the outcomes of the Senate election in Virginia and the Gubernatorial race in Vermont.

Appendix: Methodology
The ideal way to derive the impact of the LGBT vote on any particular race would be to randomly survey voters in each race and ask them who they voted for along with their sexual orientation and gender identity. While the national voter exit polling asks voter candidate preferences along with their sexual orientation (though not gender identity), it only produces national estimates of the LGB vote.
The analyses in this research brief use a common statistical procedure known as Bayes Rule to derive an estimate of the outcome of the election if only non-LGB individuals had voted. The procedure requires two assumptions:
- The size of the LGB electorate in any state is proportionate to the national LGB turnout (4%) relative to proportion of LGBT adults in each state. The latter proportion is derived using data from Gallup’s Daily Tracking Survey collected from 2012-2014. Analyses from those data estimate that 3.9% of adults in the US identify as LGBT. Assume, for example, that the Gallup data found that 4.5% of adults identified as LGBT in state X. Relative to the Gallup national LGBT estimate, the proportion of LGBT adults in state X is 1.15 times higher than the national average (4.5%/3.9%). These analyses derive an estimate if the proportion of LGB voters in that state as 1.15 x 4% (the national average of the proportion LGB among voters), or 4.6%.
- The national estimate for LGB party voting in the US House is equal in every state and reflects candidate preferences in Senatorial and Gubernatorial elections.
Assumption 1 provides the proportion of LGB and non-LGB voters by state, or put differently, the probability that voters in a particular election are LGB or non-LGB, represented as Pr(LGB) and Pr(Non-LGB), respectively.
The exit poll data is used to derive the portion of LGB or non-LGB votes that go to a particular candidate. These figures are the probability that an individual voted for a particular candidate (in this example, the Republican) given that they are either LGB or non-LGB. This is represented as Pr(𝑅|LGB) and Pr(𝑅|Non-LGB). The analyses use exit poll estimates for Republican, Democratic, and Other candidates (combined into a single estimate if there were multiple third-party candidates).
The next step in the analyses derives the proportion of LGB and non-LGB voters among voters for each candidate. Again, using the Republican candidate as an example, this is represented as the probability that a voter is LGB or non-LGB given that the voter supported the Republican candidate, represented as Pr(LGB|R) and Pr(non − LGB|R). These estimates are derived using Bayes Rule as follows:
Pr(non-LGB|R) = Pr(non-LGB) ∗ Pr (R|non-LGB)/Pr(non-LGB) ∗ Pr(R|non-LGB) + Pr(LGBT) ∗ Pr(R|LGBT)
Pr(LGB|R) = 1 − Pr(non-LGB|R)
The example above shows the calculations used to derive the proportion of LGB and non-LGB voters among Republican voters. This procedure is also used to derive the same proportions among Democratic voters and among those who supported third-party candidates.
The last step in the analytical procedures is to estimate the vote if LGB voters had not voted in the election. This is the probability that a voter supported each candidate given that the voter was non-LGB, represented as Pr(RC|non-LGB) in the case of a Republican candidate. Using Bayes Rule, this estimate is derived as:
Pr(RC|non-LGB) = Pr(RC) ∗ Pr(non-LGB|R)/Pr(RC) ∗ Pr(non-LGB|R) + Pr(DC) ∗ Pr(non-LGB|DC) + Pr(OC) ∗ Pr(non-LGB|OC)
Where Pr(RC), Pr(DC), and Pr(OC) represent the total vote in a given election for the Republican, Democratic, and Other candidates, respectively. Applying this equation to each party derives the estimates for the non-LGB vote (or the vote if LGB voters had not participated in the election) for each candidate.
Download the brief


