The Federal Employees Health Benefits (FEHB) Program provides health insurance coverage to millions of federal employees, retirees, and their dependents. The U.S. Office of Personnel Management (OPM) reports that 8.3 million individuals are covered by FEHB, which includes individuals covered through the Postal Service Health Benefits (PSHB) Program. Covered individuals include current federal employees, retirees, and dependents of both groups.
On January 28, 2025, President Trump issued Executive Order 14187, “Protecting Children from Chemical and Surgical Mutilation,” which prohibits the use of federal funds for gender-affirming care for people under 19 years of age. Executive Order 14187 explicitly directs OPM to exclude coverage for “pediatric transgender surgeries or hormone treatments” under the FEHB and PSHB. In response to this directive, on January 31, 2025, the Office of Personnel Management (OPM) issued Letter Number 2025-01A, Addendum to Call Letter for Plan Year 2026, which ordered FEHB and PSHB providers to comply with the President’s executive orders related to gender-affirming care. OPM issued a second letter on August 15, 2025, which expanded the exclusion of gender-affirming treatments to FEHB enrollees of all ages. As a result, many transgender individuals enrolled in FEHB no longer have access to insurance coverage for gender-affirming care. In this brief, we estimate that at least 39,400 transgender individuals are covered by FEHB and subject to policy changes regarding gender-affirming care.
Findings
There is no data source that directly provides the number of transgender people covered by FEHB. We estimate this number using three different models, drawing on different data sources for each model. The first model relies on the number of current FEHB enrollees (8.3 million) and current estimates of the percentage of the U.S. population that identifies as transgender. The second model relies on the current number of federal employees (2.6 million), a recent estimate of federal retirees (2.2 million), and findings from the Federal Employee Viewpoint Survey. The third model relies on findings from the 2022 U.S. Trans Survey, which is the largest survey of transgender people in the U.S. to date. The three models and their results are described in this section.
Certain data sources are common across models. A Congressional Research Service report analyzing 2015 OPM data estimated the composition of FEHB enrollees as follows: 25% of FEHB-covered individuals were current employees, 25% were retirees, and 50% were dependents of both groups. We use this estimate in all three of our models. In Models 2 and 3, we also rely on the percentage of current employees (85%) and federal retirees (90%) that participate in FEHB, as described in the same CRS report. We assume these percentages remain true for the FEHB program today.
Model 1: Applying population estimates of those who identify as transgender in the United States to FEHB-covered individuals
In this model, we estimate the number of transgender individuals covered by FEHB by utilizing known estimates of the percentage of the U.S. population that identifies as transgender and applying those percentages to the current number of FEHB-covered individuals (8.3 million) in four categories: current employees, dependents of current employees, retirees, and dependents of retirees. In 2025, using data from the CDC’s Behavioral Risk Factor Surveillance System (BRFSS) and the Youth Risk Behavior Survey (YRBS), we estimated that 0.8% of all U.S. adults and 0.3% of those aged 65 and older identify as transgender. The average age of current federal workers was around 47 in 2024, and the average age when federal workers retire was around 62 in 2023. To estimate the number of transgender current federal employees covered by FEHB, we utilize the percentage of all U.S. adults (aged 18 and older) who identify as transgender (0.8%). For retirees covered by the FEHB, we utilize the percentage of those aged 65 and older in the U.S. who identify as transgender (0.3%).
We do not know how many dependents covered by FEHB are dependents of current employees versus dependents of retirees. Here, we assume that dependents are split evenly between current employees and retirees. This is a conservative assumption because the actual number of dependents of retirees is likely much smaller than the number of dependents of current employees, and we will apply the smaller percentage for those aged 65 and older who identify as transgender (0.3%) for both retirees and their dependents. For dependents of current employees, we apply the 0.8% population percentage for adults who identify as transgender in the U.S. This is likely a conservative approach because dependents of current employees include spouses and children aged 26 and younger. Younger age groups are more likely to identify as transgender compared to older age groups, so we may underestimate the number of transgender dependents of current federal employees if these dependents are younger overall.
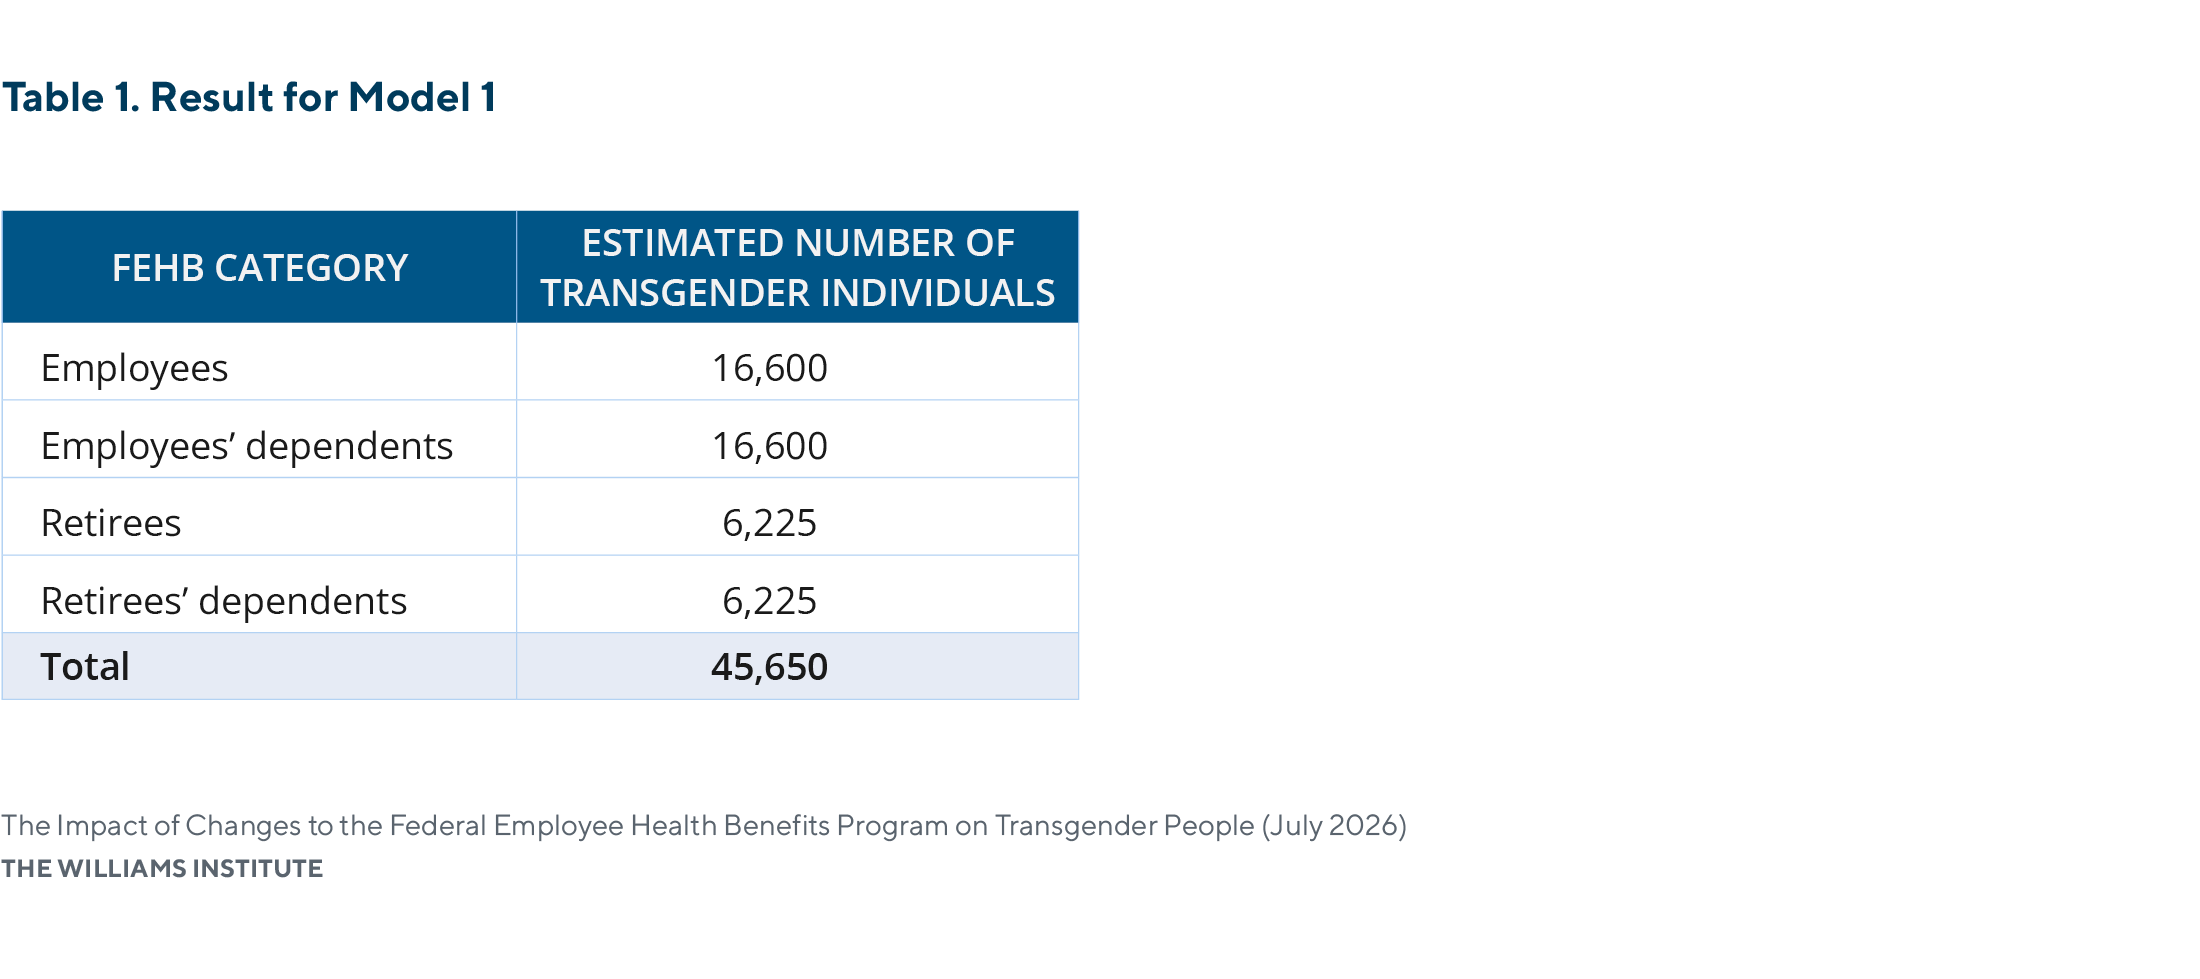
Table 1 describes the results of our calculations. Starting with the overall figure of 8.3 million individuals who are covered by FEHB, we divide this figure into the four categories of covered individuals, 25% to each category, or 2,075,000 individuals. We multiply 2,075,000 by 0.8% to estimate the number of employees who identify as transgender and, separately, the number of employees’ dependents who identify as transgender. This yields 16,600 in each of those categories. We multiply 2,075,000 by 0.3% to estimate the number of retirees who identify as transgender and, separately, the number of retirees’ dependents who identify as transgender. This yields 6,225 in each of those categories.
Several additional assumptions underlie this model. First, we assume that transgender people are represented among current federal workers and their dependents similar to the adult U.S. population (0.8%). Similarly, we assume that transgender people are represented among federal retirees and their dependents similar to the U.S. population aged 65 and older (0.3%). Our assumptions about age may overestimate or underestimate the number of transgender individuals based on active employee, retiree, and dependent characteristics. For instance, transgender people are, on average, younger than the U.S. population, and the average age of federal workers (47) is slightly older than the average age of all persons in the workforce (42). This may lead us to overestimate the number of transgender people covered by FEHB. This assumption may be balanced, at least in part, by the undercounting of transgender people among dependents, as described above. Furthermore, the average retirement age for federal workers is 62, which is lower than the 65-and-older age group we use to make this estimate. Yet the average age of federal retirees is 74, placing them in the 65-and-older age group. Finally, the percentage distribution of FEHB by status as current employees, retirees, and their dependents assumes an even percentage split among the four groups (25% each). This distribution is based on information from 2015, which may have changed, and we assume that dependents are evenly split among employees and retirees.
Model 2: Utilizing the percentage of federal workers who identify as transgender from the 2023 Federal Employee Viewpoint Survey
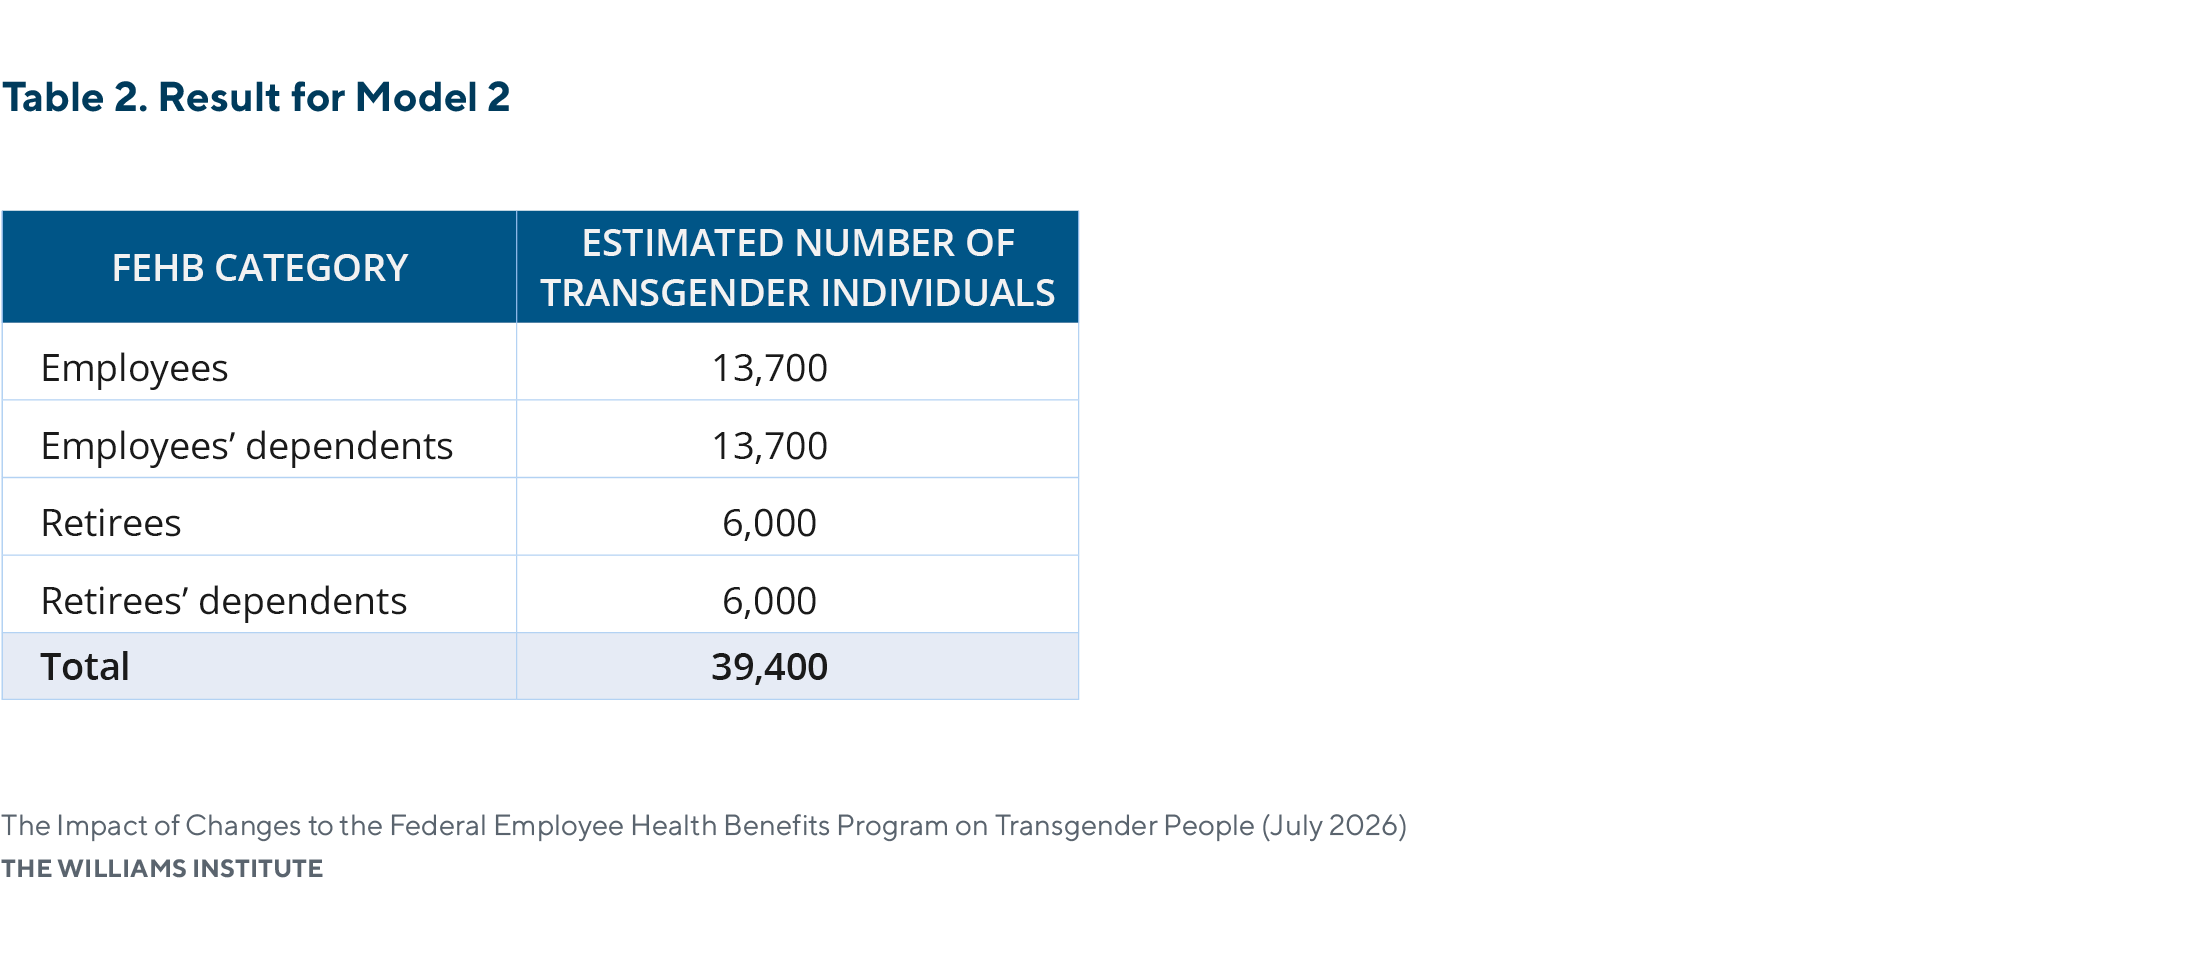
In this model, we begin by utilizing a direct estimate of the percentage of federal employees who identify as transgender and applying it to the current number of federal employees. The 2023 Federal Employee Viewpoint Survey (FEVS) found that 0.6% of federal employees identify as transgender. As of June 2026, the Bureau of Labor Statistics reported that there were 2,686,000 federal employees, including postal workers. Assuming the 0.6% population percentage from 2023 FEVS holds true in 2026, we would estimate that just over 16,000 federal employees are transgender. Eighty-five percent (85%) of federal employees participate in FEHB. Therefore, we estimate that about 13,700 transgender federal employees are covered by FEHB. Based on the distribution of FEHB individuals as 25% current employees and 25% current employees’ dependents described above, we estimate that 13,700 employee dependents identify as transgender, assuming the same percentage of employees’ dependents identifies as transgender (0.6%). This is likely a conservative assumption because dependents of current employees include spouses and children aged 26 and younger. As described above, younger age groups are more likely to identify as transgender compared to older age groups.
To estimate the number of retirees and their dependents, we rely on the number of federal retirees (i.e., retiree annuitants) and the percentage of adults who identify as transgender among those aged 65 and older in the U.S. A recent analysis by the Congressional Research Service found that just over 2.2 million individuals are federal retirees. We assume that 0.3% of these individuals identify as transgender, or about 6,700 individuals, based on the population proportion of those who identify as transgender in the U.S., aged 65 and older. Ninety percent (90%) of retirees participate in FEHB. Therefore, we estimate that about 6,000 retirees covered by FEHB are transgender. Assuming a 1-to-1 ratio of retirees to retiree dependents, and utilizing the same population percentage of those who identify as transgender (0.3% of those aged 65+), we estimate that 6,000 retiree dependents identify as transgender. Table 2 summarizes these findings and the final result of this model.
Several assumptions underlie Model 2. First, we assume that the same percentage of current federal employees identify as transgender as they did in the 2023 FEVS (0.6%). Second, we assume employees’ dependents are as likely to identify as transgender as current federal employees (0.6%). This approach likely undercounts transgender employee dependents because of the likely lower average age of these dependents. As in Model 1, we assume federal retirees and their dependents identify as transgender in proportions similar to the U.S. population aged 65 and older, and that the percentage distribution of FEHB by status as current employees, retirees, and their dependents is an even percentage split among the four groups (25% each). Finally, we assume that employees, retirees, and dependents of both groups who identify as transgender participate in FEHB in percentages similar to all federal employees (85%) and all retirees (90%).
Model 3: Applying the percentage of federal employees among those employed in the 2022 U.S. Trans Survey to the number of adults who identify as transgender in the U.S.
In this model, we utilize findings from a large, national survey of transgender individuals and the current estimated number of adults in the U.S. who identify as transgender. The 2022 U.S. Trans Survey (USTS) is the largest survey sample of transgender people in the U.S. to date (n=92,329). Although not nationally representative, some findings from the smaller 2015 USTS (n=27,715) have been found to be similar to those from nationally representative surveys. Here, we utilize data from the 2022 USTS to estimate the number of transgender individuals covered by FEHB. The 2022 USTS asked respondents about their current employment status, and 61.2% of respondents were employed. Of those employed full-time or part-time by an employer, respondents were asked about employment sector, including work for the government. Those who responded they worked for the government were asked if they worked for the federal government. Of all employed adult respondents to the 2022 USTS, 2.8% worked for the federal government.
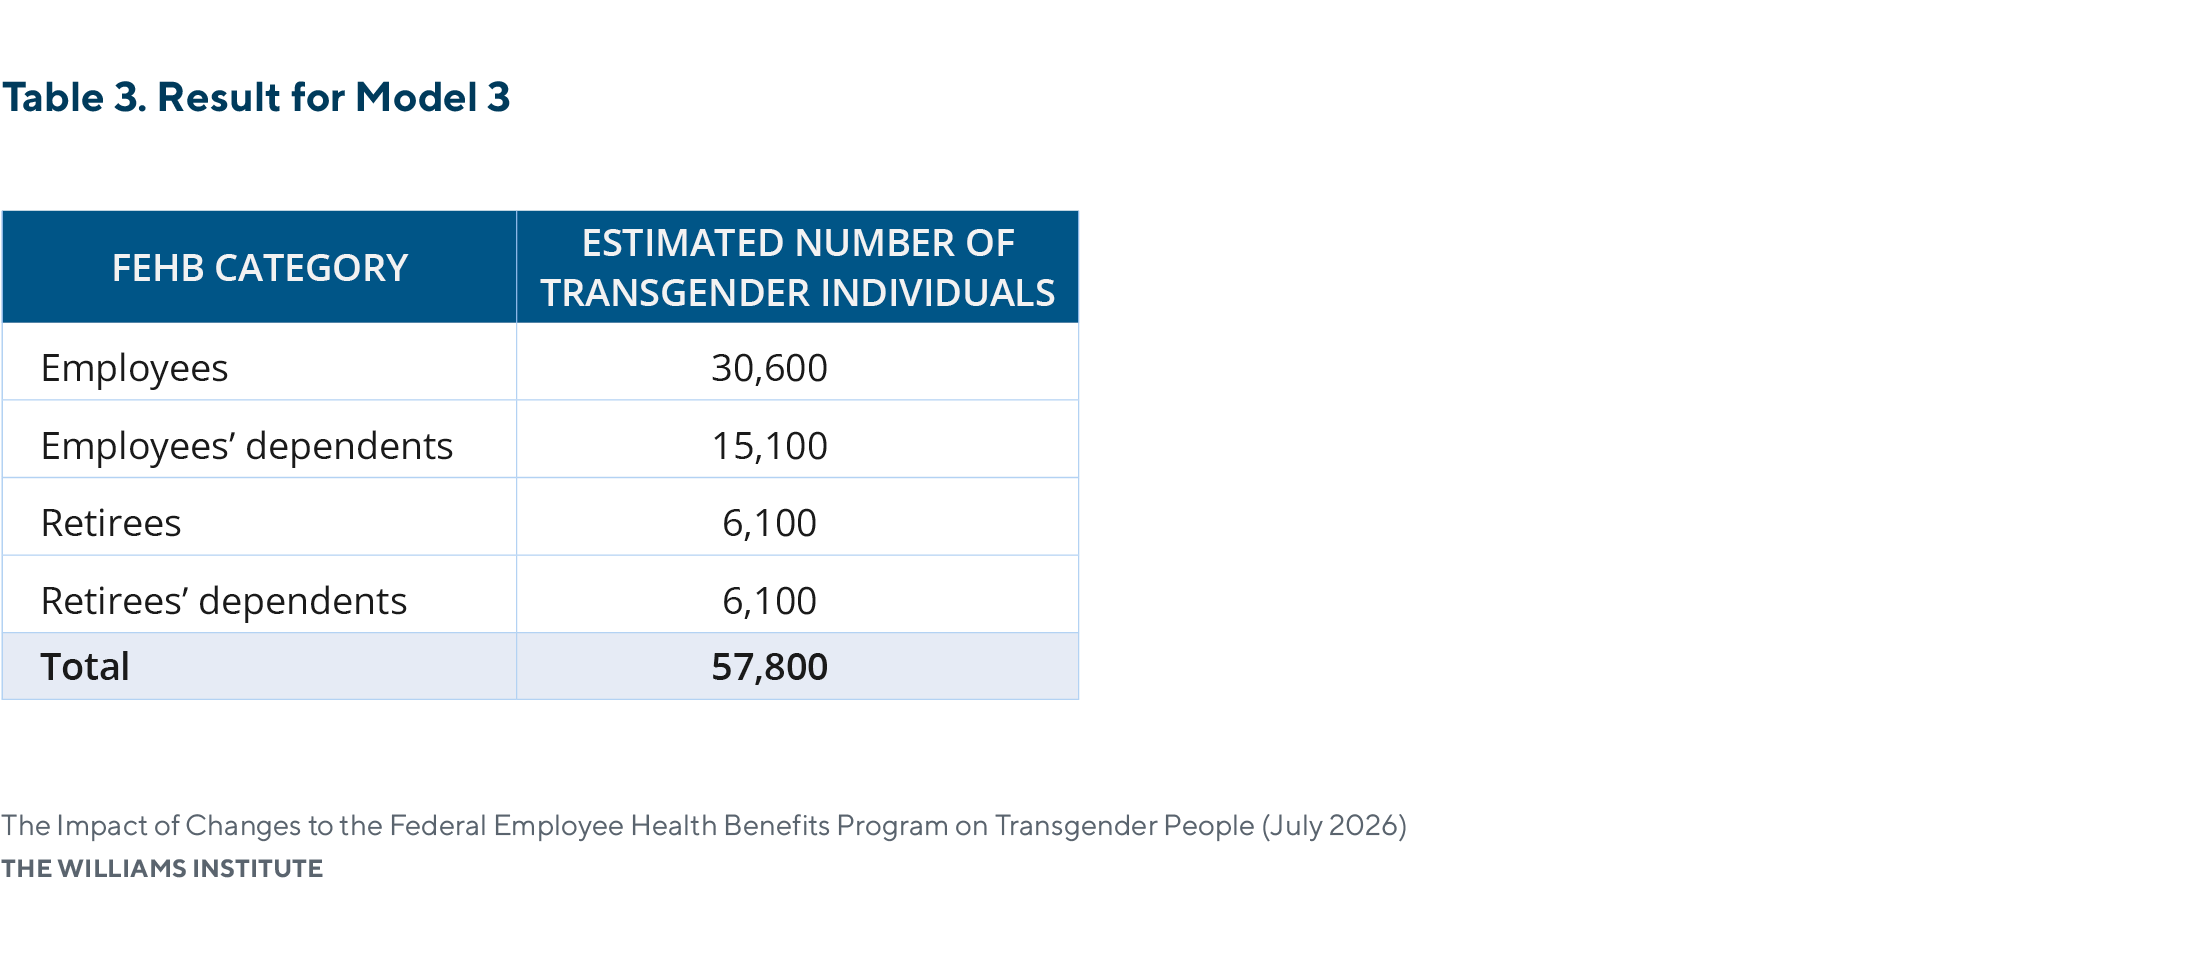
We previously estimated, based on the CDC’s BRFSS, that 2.1 million adults in the U.S. identify as transgender. Applying the USTS findings described above, we find that 1,285,200 adults who identify as transgender are employed. Of those, we estimate that about 36,000 (2.8%) work for the federal government. As described in Model 2 above, we assume 85% of those workers are covered by FEHB, or about 30,600 individuals.
2022 USTS does not provide data for us to estimate the number of federal employees’ dependents, retirees, or dependents of retirees. Given available data sources, we could approach estimates for these groups in a manner similar to either Model 1 or Model 2. Given that both models have unique strengths and limitations, for Model 3 we use an average of the estimates from Model 1 and Model 2 to provide estimates for employees’ dependents, retirees, and retirees’ dependents who identify as transgender, rounded to the nearest 100. See Table 3.
Several assumptions underlie Model 3. First, we assume that findings from the 2022 USTS are representative of the U.S. transgender population. Although the 2022 USTS has a large sample size, the sample was drawn using non-probability sampling. This means the findings may not be representative of the transgender U.S. population overall. Finally, since we average results from Models 1 and 2 to arrive at estimates for the numbers of transgender employee dependents, retirees, and retirees’ dependents, the assumptions underlying Models 1 and 2 for these groups apply here as well.
Conclusion
Based on the three models described above, we estimate that the number of individuals covered by FEHB who identify as transgender would be at least 39,400, ranging from 39,400 as a lower bound estimate to 57,800 as an upper bound estimate, with 45,650 as a lower mid-range estimate. The precision of our estimates would be improved with additional data, such as the age composition of employees’ dependents and the actual ratio of retirees in FEHB to retirees’ dependents. The assumptions underlying these models may underestimate the true number of transgender individuals covered by FEHB; however, we cannot be certain of the magnitude or direction of the bias without additional data.
Download the full brief