Executive Summary
The LA County Trans & Nonbinary Survey1 was conducted in 2023 and 2024 to shed light on the needs and experiences of trans and nonbinary people living in LA County. The survey was conducted by the TransLatin@ Coalition and the Williams Institute, in collaboration with the Royal Collection Corporation and the Connie Norman Transgender Empowerment Center (CoNoTEC).
Nearly one-third (30%) of the respondents to our LA County Trans & Nonbinary Survey indicated that they are immigrants. Using data collected from these community members in 2023-2024, we paint a portrait of their experiences, including the demographics, identity documents, happiness, community connectedness, economic well-being, sources of income, employment experiences, housing, transportation needs, health care, and law enforcement interactions of our immigrant respondents.
After the collection of data in the LA County Trans & Nonbinary Survey, the election of Donald Trump as the President of the United States resulted in a shift in federal policy on both immigration and transgender rights,2 likely affecting many of the respondents to this survey.3 In this report, we focus on the experiences and needs of trans and nonbinary respondents prior to the shift in federal policy.
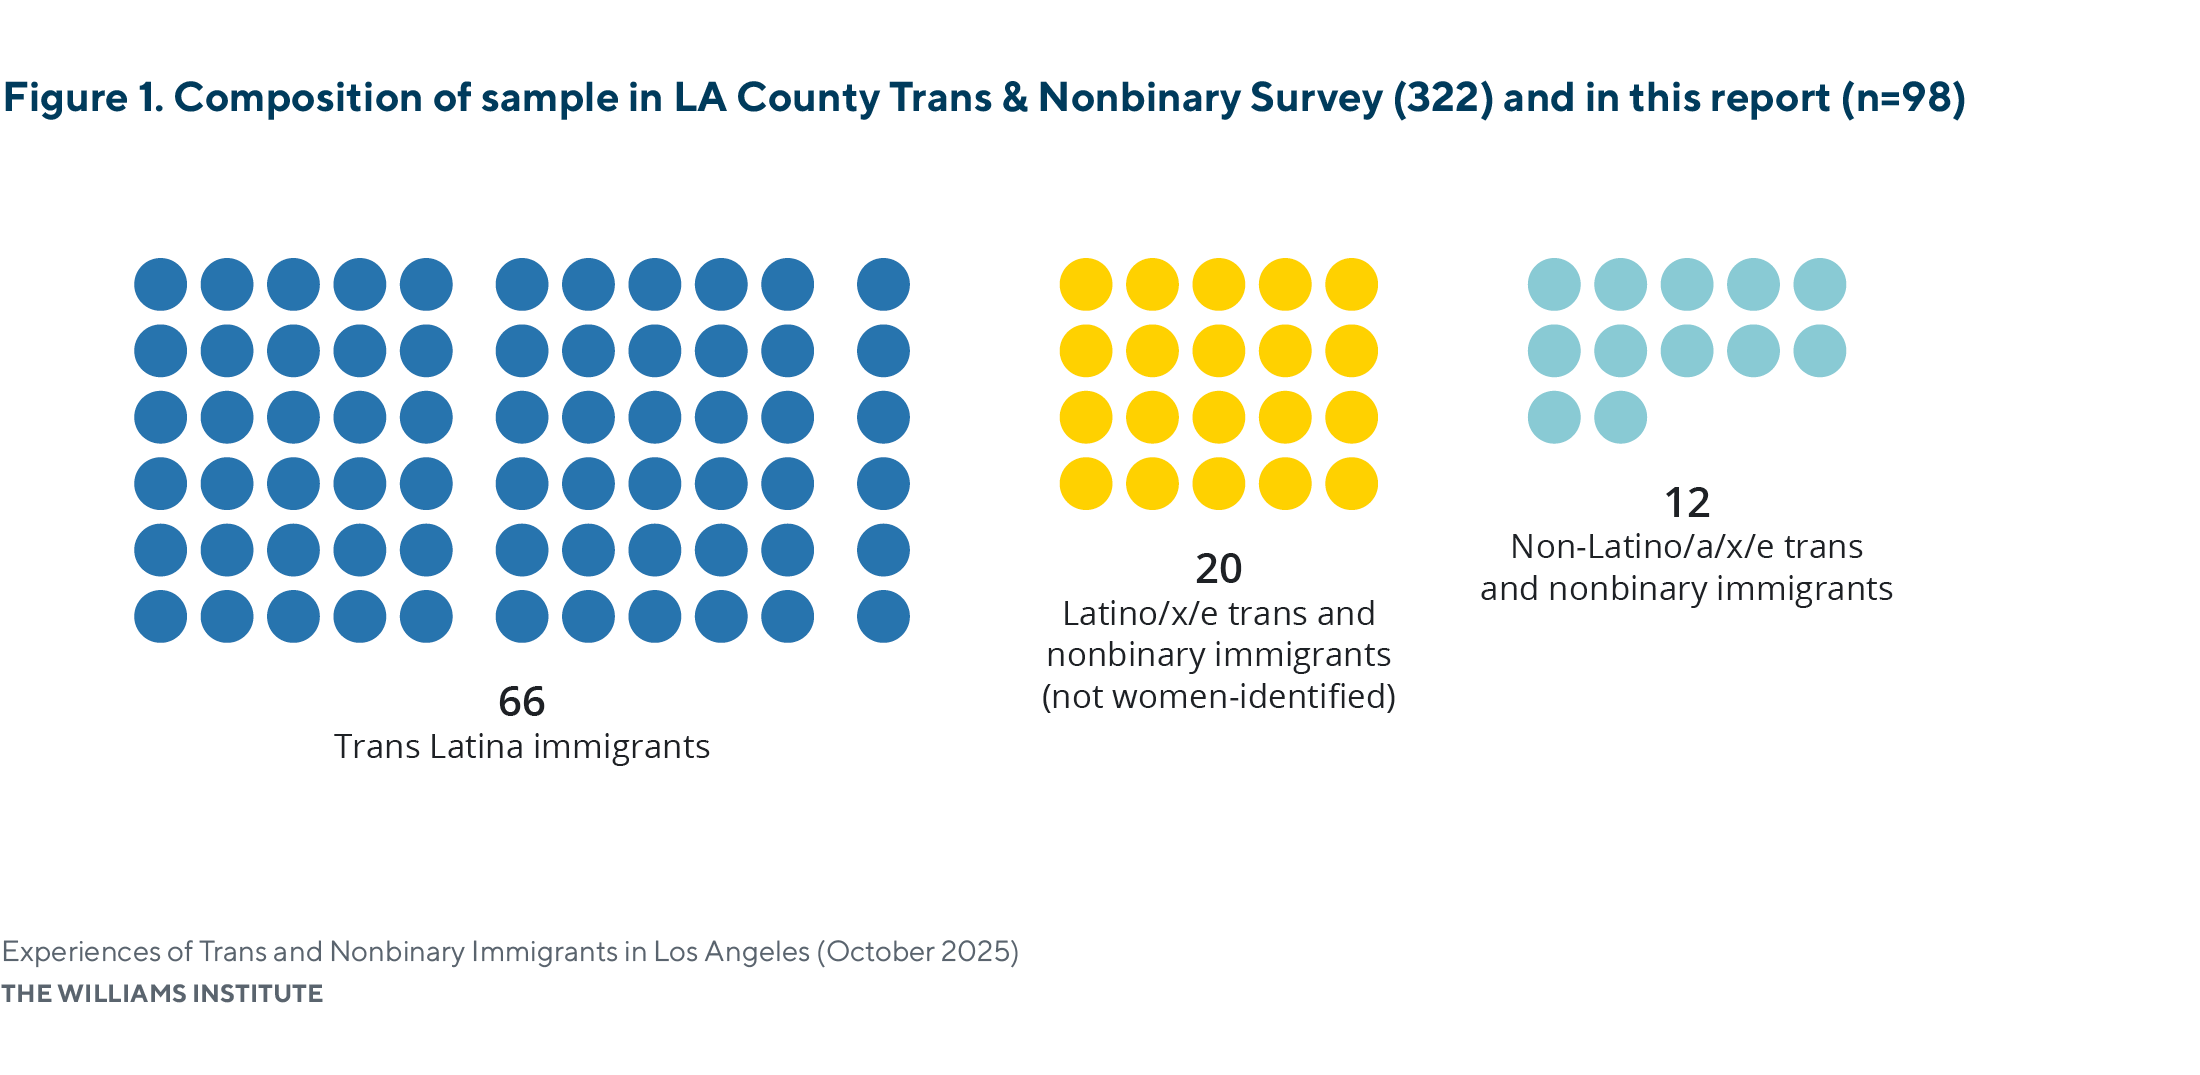
The composition of our sample also enables us to look at some of the experiences of trans and nonbinary immigrants through an intersectional lens. For example, eighty-eight percent (88%) of immigrant respondents to our survey identified as Hispanic, and a full two-thirds of immigrant respondents (67%) identified both as Hispanic and as trans women. Because of the large proportion of trans Latina immigrants in our sample, we chose to highlight, where data permits, findings specific to this population.
Key Findings
Demographics
- Immigrant respondents in our study held a wide variety of immigration statuses. The most common were Lawful Permanent Resident (30%) and Refugee or Asylum Status (29%).
- The vast majority (88%) of immigrant respondents to our survey were Latino/a/x/e.
- Immigrant and trans Latina immigrant respondents appear to be older than the other respondents to the survey.
- Fifty-seven percent (57%) of immigrant respondents were aged 35 or older.
- Nearly two-thirds of trans Latina immigrant respondents (64%) were aged 35 or older.
- Immigrant respondents were more than twice as likely to identify as women or trans women than non-immigrant respondents (67% vs. 29%) and less likely than non-immigrant respondents to identify as nonbinary, genderfluid, or genderqueer (16% vs. 42%).
- Immigrant respondents were nearly three times more likely than non-immigrants to report their sexual orientation as straight (44% v. 17%). Fifty-eight percent (58%) of trans Latinas reported their sexual orientation as straight.
- In terms of educational attainment, immigrant respondents tended to have lower overall levels compared to non-immigrant respondents. Immigrant respondents were nearly four times more likely to have less than a high school level of education: Thirty percent (30%) of immigrant respondents overall (and 41% of trans Latina immigrants) had less than a high school or GED level of education, compared with only 8% of non-immigrants.
Happiness, Community, and Priority Issues
- Although many immigrants (34%) reported being very happy with how things are going in their lives, immigrants also appear more likely than non-immigrants to report that they were not too happy with how things are going (28% vs. 18%).
- Economic issues were a priority for many immigrant respondents. Half or more of all immigrant respondents reported that cost of living, housing, and debt were serious problems as a trans or nonbinary person in LA.
- One-quarter of immigrant respondents (25%) and nearly one-third of trans Latina immigrants (29%) reported that they felt more comfortable accessing services from government offices, as opposed to community-based organizations. Immigrant respondents were three times more likely than non-immigrant respondents (8%) to report this.
Economic Well-Being
- Eighty percent (80%) of immigrant households in our study and 84% of trans Latina households had an annual income under $25,000. Thirty-eight percent (38%) of immigrant households and 44% of trans Latina households reported no income at all.
- Seventy-three percent (73%) of immigrant respondents and 80% of trans Latina immigrant respondents live near or under the Federal Poverty Line.
- Fifty-nine percent (59%) of immigrant respondents and 62% of trans Latina immigrant respondents reported that it had been somewhat or very difficult to pay usual household expenses in the last three months.
- •Half (50%) of immigrant respondents and 55% of trans Latina immigrant respondents reported they sometimes or often didn’t have enough to eat in the last three months.
Sources of Income and Employment Experiences
- Unemployment rates were higher among immigrant respondents (47%) compared to non-immigrant respondents (22%). Fifty-four percent (54%) of trans Latina respondents reported that they were currently unemployed.
- Thirty-eight percent (38%) of immigrants reported a negative experience in the workplace because they are trans or nonbinary.
Housing
- Thirty-nine percent (39%) of immigrant respondents and 40% of trans Latina immigrants reported that they were currently experiencing homelessness—twice the rate of non-immigrants (19%).
- Forty percent (40%) of immigrants and 41% of trans Latina immigrants attributed their homelessness to their trans or nonbinary status. Among the overall population of LA County, 0.8% are currently homeless.
- Among immigrant respondents who are currently housed, 91% were cost-burdened.
- Fifty-eight percent (58%) of immigrant respondents, including 70% of trans Latina immigrant respondents, were denied the rent or purchase of a house, apartment, or condo in LA County in the last five years.
- Thirty-eight percent (38%) of immigrant respondents and 52% of trans Latina respondents reported that they were denied because of their trans or nonbinary status.
Transportation
- Immigrant respondents were nearly twice as likely as non-immigrant respondents to report that they most often used public transportation to commute to work or school (50% vs. 28%).
- Immigrant respondents were nearly twice as likely as non-immigrant respondents to report that they were unable to get to work at some point in the last three months because of transportation issues (29% vs. 15%). One third (34%) of trans Latina immigrant respondents reported this issue.
Health
- Immigrant respondents in our sample were about four times more likely to be uninsured, compared with non-immigrant respondents (30% vs. 7%).
- For those who sought medical care, immigrants appeared more likely than non-immigrants to have accessed care in a public medical system (21% vs. 14%) and half as likely to have used private medical systems (20% vs. 40%), compared with non-immigrants.
- Over one-third (36%) of immigrants had delayed or not gotten necessary medical care in the last 12 months.
Access to Gender-Affirming Care
- Immigrants were less likely to have received several types of gender-affirming care that we asked about, compared to non-immigrants.
- Immigrant respondents were less likely than non-immigrant respondents to have received surgical care (22% vs. 39%).
- Almost one-third of immigrant respondents (30%) reported not having received any of the types of gender-affirming care we asked about.
Law Enforcement Experiences
At the time of the survey…
- Thirty-one percent (31%) of immigrant respondents reported they would feel somewhat or very uncomfortable asking for help from law enforcement in LA County. Of immigrant respondents who reported that they did not feel comfortable asking for help:
- Half (53%) reported that they felt law enforcement officers might disrespect or harass them.
- Forty percent (40%) felt that the police might arrest them or someone close to them because of their immigration status.
- Forty-nine percent (49%) reported that they might feel more comfortable seeking help if they knew there was an LGBTQ liaison.
- Fifty-three percent (53%) reported they might feel more comfortable if they knew that law enforcement officers had received training on how to treat trans and nonbinary people.
- Immigrant respondents appear more likely to have been arrested in the last five years in LA County, compared to non-immigrants (18% vs. 9%).
Immigration Experiences
At the time of the survey…
- Sixty-three percent (63%) of immigrant respondents in our sample had applied for political asylum status.
- Seventy-nine percent (79%) of immigrants who applied for political asylum were approved for a form of lawful status.
- Eighty-three percent (83%) of all asylum applicants had help from attorneys.
- Half of all immigrant respondents (50%)—13 percent of the total sample—had been held in immigration detention at some point in their lives. This includes 52% of trans Latina immigrant respondents.
- Nearly one-third (31%) of immigrant respondents who were detained were physically assaulted.
Download the full report
Download the report in Spanish