Age: Respondents ranged from 18 to 81 years old, although over three-fourths were under 35.
Caste/Ethnicity: Participants listed over 150 unique caste and ethnic groups, although almost half identified as Janajati (16 percent), Chhetri (12 percent), Brahmin (10 percent), Dalit (7 percent), or Tharu (7 percent).
Religion: Similar to Nepal’s population, the vast majority of respondents identified as Hindu (88 percent), with an additional 6 percent identifying as Buddhist.
Language: The most common languages spoken were Nepali (62 percent), Bhojpuri (12 percent), and Maithill (10 percent).|
Gender: Forty-four percent of the sample identified as third gender, 33 percent as third gender male, and 7 percent as third gender female. Eighty-six percent of the respondents were assigned male at birth and 14 percent were assigned female at birth. Although further research is necessary, this gender distribution is possibly consistent with the effects of extreme marginalization faced by individuals assigned female at birth, as well as programmatic priorities of MSM/HIV work which affected sampling activities.
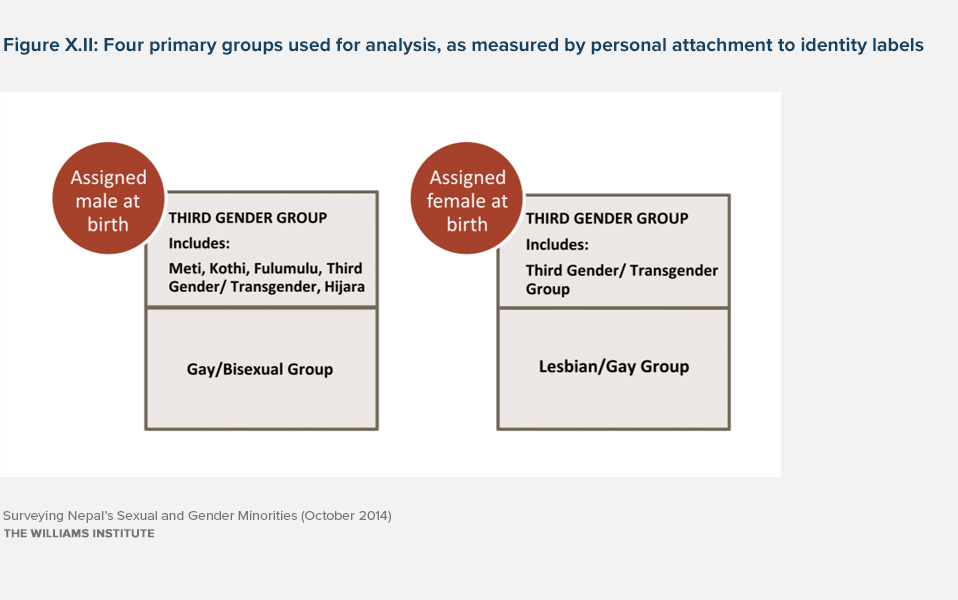
Previous studies have indicated that our assigned male at birth and assigned female at birth respondents may have different experiences due to cultural expectations. For example, assigned male at birth respondents identified with third gender, as well as other terms that relate to gender identity (e.g., Meti or Kothi). Assigned female at birth respondents who identified with “third gender” had no real attachment to these other terms. Since respondents who were assigned female at birth comprise a smaller portion of the overall sample, this report at times reports findings overall and also by assigned sex at birth.
Sexual Orientation and Gender Identity Diversity
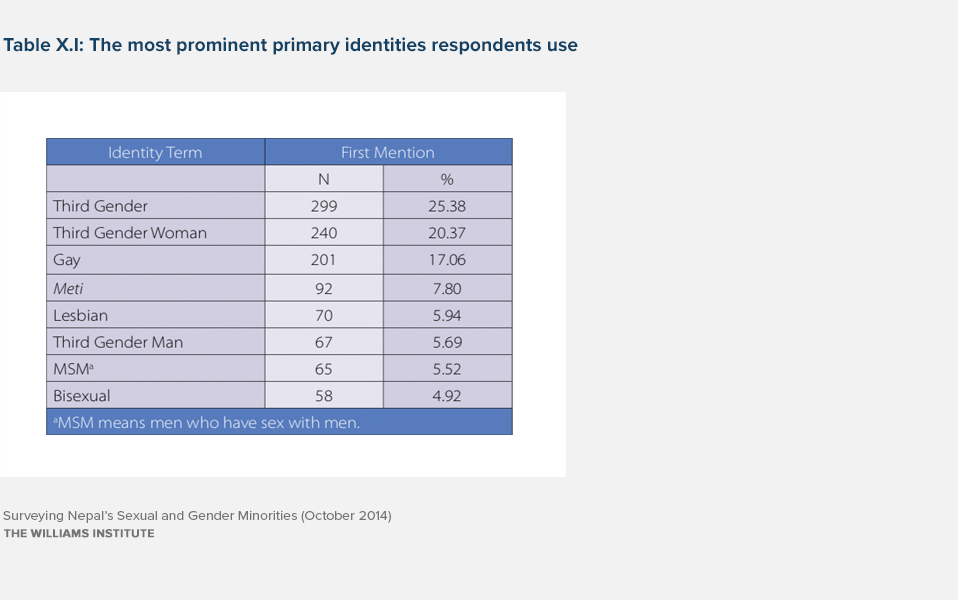
Respondents were asked to write in the term that describes their primary gender and/ or sexual identity. The almost 1,200 respondents used 21 different terms. Notably, over half of the sample used third gender, third gender woman, or third gender man. This means even with the most optimal implementation, the question in the 2011 Nepal Census would have identified, at most, 51.4 percent of the people in the Williams Institute/BDS survey. By adding Meti and Gay, Lesbian, Bisexual, Heterosexual, and MSM, the census would provide over 92 percent of our sample with terms they would choose themselves to describe their primary sexual or gender identity. Adding an additional seven terms (Kothi, Maugiaya, Natuwa, Hijara, Dhuranji, Nechani, and Intersex) would have provided our entire sample with terms they would choose themselves to describe their primary identity.
Based on these study findings, in order to create data sets that accurately include the Nepali sexual and gender minority population, we recommend that survey designers and administrators consider:
- including sexual orientation and gender identity terms on survey instruments that are culturally appropriate and inclusive;
- when possible, allowing respondents to self-select the term they want to use to identify their gender, including selecting more than one term;
- adding definitions of sexual orientation and gender identity (SOGI) terms to all manuals, guides, and implementation instructions to ensure terms are understood and explained respectfully during survey interviews;
- placing SOGI-related measures on surveys so that the questionnaire has appropriate questions for that population and does not inadvertently exclude sexual and gender minority respondents;
- training all survey administrators on the meanings of the SOGI terms and instructions for asking about them, especially in instances where the definitions of the terms carry assumptions about sexual behaviours and attractions;
- including representatives from sexual and gender minority communities in survey design consultation processes, including drafting, outreach and education, monitoring and evaluation and, when possible, analysis.
Sexual Attraction and Behaviour
Of those assigned male at birth, 93 percent reported being attracted to males. Substantial percentages also reported being attracted to Panthis (40.6 percent), females (16.7 percent), and Metis (11.8 percent). A majority of respondents who were assigned male at birth had attractions that related to their behaviours.
Those in the Third Gender Assigned Male at Birth Group most often reported attraction to males (94.6 percent) and Panthis (46.2 percent). Those in the Gay/Bisexual Group mainly reported attraction to males (86.9 percent) and females (38.8 percent).
Those in the Third Gender Assigned Male at Birth Group most often reported recent sexual partners to be males (97.5 percent) and Panthis (39.3 percent). Those in the Gay/Bisexual Group mainly reported recent sexual partners to be males (80.4 percent) and females (41.5 percent).
Of respondents who were assigned male at birth, 2.3 percent reported not having sex in the past 12 months.
Of respondents who were assigned female at birth, 72 percent reported being attracted to females. A majority of those who were assigned female at birth had attractions that related to their behaviours.
Those in the Third Gender Assigned Female at Birth Group most often reported attraction to females (89 percent) while those in the Lesbian/Gay Group mainly reported attraction to females (56 percent) and third gender men (36 percent).
Those in the Third Gender Assigned Female at Birth Group most often reported recent sexual partners to be females (79 percent) or reported not having sex (14 percent), while those in the Lesbian/Gay Group mainly reported having sex with third gender men (48 percent), females (38 percent), and not having sex (17 percent).
Relationship Status
When asked about their relationship status, approximately two-thirds reported currently being in one or more relationships. Over one-third of respondents reported multiple spouses, 18 percent reported a single spouse, and approximately 12 percent reported either a “partner” or a “cohabitating boyfriend or girlfriend.”
The much higher rate of reporting multiple spouses than the general population in Nepal (1.4 percent) may be the result of reporting relationships that have not been legally recognized. This could indicate, for instance, that some are in different-sex marriages while having a significant same-gender or different-gender relationship that is not legally recognized. Over 42 percent of the Third Gender Assigned Male at Birth Group reported having multiple spouses followed by almost 27 percent of the Gay/Bisexual Group. Neither of the assigned female at birth groups reported high rates of multiple spouses.
The Gay/Bisexual Group (37 percent) and Third Gender Assigned Female at Birth Group (31 percent) were more likely to report being single than the other two groups (21 percent for Third Gender Assigned Male at Birth Group; and 24 percent for the Lesbian/Gay Group).
Respondents reported much higher divorce or separation rates (2.3 percent) than the Nepali population in general (0.3 percent).
Gender Identity on Citizenship Documents
The 2007 Nepal Supreme Court case Pant v. Nepal ordered the government to recognize three genders. In 2013, the Ministry of Home Affairs has directed that citizenship documents be issued in three genders – male, female, and other (Anya) – without requiring any medical or other “expert” certification.
Over 92 percent of the sample had not tried to change their gender on their citizenship documents. The survey did not seek to determine why respondents had not tried. We recommend additional research to explore why so many respondents have not tried to change their citizenship documents.
Of the 8 percent (n=82) who reported that they had tried to change their gender, almost 90 percent were from the Third Gender Assigned Male at Birth Group.
Of those who attempted to change their documents only 7 percent (n=5) were successful and only one of those individuals was assigned female at birth.
Socio-Economic Vulnerability
While our sample may not be representative of sexual or gender minorities overall in Nepal, respondents reported higher socio-economic status than the general population of Nepal across a number of indicators. However, the indicators consistently showed that the largest group of respondents, those in the Third Gender Assigned Male at Birth Group, was worse off than our other three groups. In addition, some results suggest that those who were assigned female at birth may share some similar economic vulnerability as cisgender women in Nepal.
Literacy and Education: Eighty percent of respondents could read and write, which was higher than Nepal’s literacy rate of 60-66 percent. Though respondents reported higher literacy rates than the overall population, those in the Third Gender Assigned Male at Birth Group reported lower rates of literacy. While only 73 percent of the Third Gender Assigned Male at Birth Group reported they could read and write, 92 percent to 96 percent of the three other groups reported they could read and write.
Overall, over 18 percent reported having completed higher education, (college or university) compared with 10 percent of Nepal’s entire population. Though respondents reported higher levels of education, those in the Third Gender Assigned Male at Birth Group reported less education than those in other groups. Only 12 percent of the Third Gender Assigned Male at Birth Group reported some higher education compared to over 34 percent of the Gay/Bisexual Group. The respondents who were assigned female at birth reported rates of accessing higher education at 18 percent to 20 percent.
Employment: Over a quarter of the respondents (28.5 percent) had not worked in the past year with their primary reasons being unemployment (43 percent) or being a student (27 percent). Almost half (49 percent) of the respondents reported that the majority of their employment was in salary/wage work, followed by employment in agriculture (14 percent).
Income: Overall, respondents reported an average income that is nearly twice the average per-capita income of Nepal’s adult population (Rs. 88,386 compared to Rs. 46,020). However, approximately 14 percent of the respondents who were assigned male at birth reported no income, compared to 9 percent of the Third Gender Assigned Female at Birth Group and 7 percent of the Lesbian/Gay Group.
Over half of respondents (51 percent) reported that their income was less than adequate to meet their personal needs. Those in the Third Gender Assigned Male at Birth Group and the Lesbian/Gay Group had higher rates of reporting income inadequacy (55 percent and 56 percent). By comparison, less than 40 percent of the Gay/Bisexual Group reported income inadequacy.
Experiences of Discrimination, Harassment, and Abuse
Respondents were asked about experiences of discrimination, harassment, and abuse in seven areas of public life. Overall, they reported high rates of discrimination and harassment, but those experiences varied by different areas of public life, whether respondents identified as third gender, and whether they felt others perceived them to be a sexual or gender minority.
Over 60 percent of all respondents reported experiencing at least one incident of abuse or discrimination in one of seven public settings and over one-third reported discrimination or abuse in three or more of these settings.
The type of discrimination respondents reported varied by the setting. For example, the most common form of discrimination in health care settings was denial of service (23 percent). Physical abuse was the most common form of discrimination reported in relationship to law enforcement (23 percent). The most common form of discrimination was verbal harassment in stores (42 percent), public transportation (40 percent), and schools (16 percent).
Overall, experiences of discrimination were much more likely to be reported by those who identified as third gender regardless of sex assigned at birth. Respondents who identified more strongly as gender-conforming identities more often reported not experiencing discrimination, and they also believed others perceived them as not being a sexual minority.
Cases of discrimination were reported at particularly high rates by people who were Third Gender Assigned Male at Birth. Of respondents in this group, 42 percent reported being denied services, 73 percent reported being verbally harassed, and 43 percent reported being physically abused in at least one setting. These rates are quite different from those in the Gay/Bisexual Group, of which 11 percent reported being denied services, 29 percent reported being harassed, and 12.3 percent reported being physically abused in at least one setting.
Overall, respondents who were assigned female at birth had lower rates of discrimination than respondents who were assigned male at birth. Respondents in the Third Gender Assigned Female at Birth Group tended to report facing a type of discrimination at least twice as often as the Lesbian/Gay Group.
Denials of Health Care: Almost one in four respondents (23.2 percent) reported being denied services or treatment by a hospital or a health clinic. Almost 30 percent of those in the Third Gender Assigned Male at Birth Group reported denial of health care, followed by 15 percent of the Third Gender Assigned Female at Birth Group, 7 percent of the Gay/Bisexual Group, and 3 percent of the Lesbian/Gay Group, suggesting prejudice or bias against people who are gender non-conforming results in those individuals experiencing higher rates of discrimination.
Twelve percent of respondents reported that they had not tried to access a hospital or health clinic and 21 percent reported that they thought the reason they had not experienced discrimination when seeking health care was because they were not perceived to be a sexual or gender minority.
Abuse by Law Enforcement: Interactions with law enforcement showed similar patterns, with gender non-conforming respondents experiencing more incidents of discrimination. For example, 32 percent of those in the Third Gender Assigned Male at Birth group reported physical assault during interactions with police officials. People who were assigned male at birth and identified very strongly with gender non-conforming terms (a subpopulation of this group) experienced even higher rates (41 percent) of physical violence.
Harassment on Public Transportation: Over half of the Third Gender Assigned Male at Birth Group (53 percent) reported verbal harassment while using public transportation. By contrast only 15 percent of the Gay/Bisexual Group reported such harassment. Rates of verbal harassment were more prevalent for Third Gender Assigned Female at Birth respondents (25.3 percent) when compared to Lesbian/Gay respondents (8 percent). These patterns of verbal abuse also suggest perceived gender non-conformity can impact sexual and gender minorities’ experiences in public.
Government Officials, Judges, and the Legal System: In interactions with government officials, judges, and the legal system, low rates of discrimination were reported, but these rates were likely impacted by the relatively low rates of interaction with these entities generally, and some indication that respondents may not have been perceived as sexual and gender minorities in those situations.
HIV Knowledge, Testing, Treatment, and Experiences
Knowledge of HIV: Almost all respondents (98 percent) had heard of HIV, and this finding did not vary across the four major SOGI analytic groups we identified. This high level of knowledge may be because an HIV-services provider, BDS, contacted most of the respondents to participate in the survey.
In terms of where they reported learning about HIV, the principal sources of information were friends (37 percent), organizations (31 percent), radio (27 percent), and textbooks (22 percent). Television, health workers, newspapers, and leaflets ranked significantly below these sources (11 percent to 17 percent).
However, sources of HIV-related information differed by group. The top two sources of HIV-related information for the largest group, Third Gender Assigned Male at Birth, were friends and organizations, while the top two sources for the other three groups were radio and textbooks.
Testing: Overall, 20 percent of the sample had not been tested for HIV while 30 percent reported being tested frequently. Over 60 percent reported being tested in the last year and BDS and other community-based organizations were the most commonly reported testing sites, followed by VCT (voluntary counseling and testing) centers.
The groups of those assigned female at birth were the least likely to be tested (71 percent and 83 percent reported not having been tested) while only 18 percent of the Gay/Bisexual Group had not been tested and only 10 percent of the Third Gender Assigned Male at Birth Group had not been tested.
Treatment: Ten percent of the sample reported being HIV-positive – and only one of those who reported being HIV-positive was assigned female at birth. Rates of being HIV-positive were similar among respondents assigned male at birth, regardless of SOGI group (12 percent versus 11 percent).
Over two-thirds of those who were positive (67 percent) reported being on treatment for HIV. The reported antiretroviral therapy enrollment rate is nearly three times that of the general positive population and 58.0 percent of respondents living with HIV received their services from NGOs. In addition, 41 percent of those who were HIV-positive reported having health problems.
Disclosure: Those who were positive were much more likely to have disclosed their status as HIV-positive at work than at home or when seeking health care. Almost 54 percent reported disclosing to no one at home while only 27 percent reported disclosing to no one at work. Only 17 percent of respondents reported having disclosed their status as HIV-positive to health care workers when seeking care. Almost half (49 percent) had disclosed their HIV-positive status to their boss and over 40 percent had told four or more people at work.
Discrimination: The most commonly reported experience of HIV discrimination was in denial of health care services. One-third of HIV-positive respondents reported this type of discrimination. Nine percent also reported verbal harassment in health care settings. Almost 1 in 6 HIV-positive respondents reported physical abuse by law enforcement. HIV-positive respondents also reported high rates of verbal harassment in stores (18 percent), public transportation (16 percent), and by law enforcement (13 percent).
Conclusion
The data and analysis presented in this report provide a glimpse into the lives of sexual and gender minorities in Nepal. By capturing information about sexual orientation and gender identity, as well as behavioral and attraction elements, this research was able to examine the relationships between SOGI, experiences of discrimination and their impacts, and access to HIV services. By building the survey instrument from other population studies and in consultation with Nepali activists, the information gathered and analyzed in this report sheds light on how survey instruments can and should be inclusive of sexual and gender minorities, and why data about the experiences of sexual and gender minority people should influence policy, planning, and interventions.
Download the full report
Download the supplement