The Williams Institute estimates that 1,171,000 LGBT adults ages 18-64 years old have Medicaid as their primary source of health insurance. While the majority of LGBT adults with Medicaid are employed, an estimated 542,000 may be at risk of losing coverage due to work or community service requirements that states may impose under guidance released on January 11, 2018 by the US Department of Health and Human Services.
Fact Sheet
LGBT Adults with Medicaid Insurance
January 2018
Medicaid was signed into law in 1965 to provide health care coverage to low-income people. Using data from the Gallup Daily Tracking Survey, this fact sheet estimates the number of LGBT people who currently have Medicaid as their primary source of health insurance.
Fact Sheet
Over half a million LGBT adults face uncertainty about health insurance coverage due to HHS guidance on Medicaid requirements
These estimates include 194,000 LGBT adults who are unemployed and up to 348,000 who are unable to work and may not meet Medicaid disability eligibility criteria or meet other criteria for exemption from work and community service requirements. Nearly 84,500 LGBT adults who reside in 10 states (including Arizona, Arkansas, Indiana, Kansas, Kentucky, Maine, New Hampshire, North Carolina, Utah, and Wisconsin) that are considering adopting these requirements may be at immediate risk of loss of health insurance coverage.
Data Source: 2015-2017 Gallup Daily Tracking Survey
In 2016, there were an estimated 200,241,033 adults ages 18 to 64 in the U.S. In unpublished analyses conducted by the Williams Institute, 5.1% of adults who responded to the Gallup Daily Tracking Survey between January 2015 and June 2017 identified as LGBT (Williams Institute unpublished analyses); 11.5% of LGBT adults in the Gallup sample who were posed a question about their primary source of health insurance reported Medicaid coverage. For total 18-64 population estimates: search American FactFinder, last visited Jan. 12, 2018, select advanced search, enter “Annual Estimates of the Resident Population for Selected Age Groups by Sex for the United States, States, Counties and Puerto Rico Commonwealth and Municipalities: April 1, 2010 to July 1, 2016” under topic or table name, and select “Annual Estimates of the Resident Population for Selected Age Groups by Sex for the United States, States, Counties and Puerto Rico Commonwealth and Municipalities: April 1, 2010 to July 1, 2016” for 2016 population estimates based on the 2010 U.S. Census.
https://www.medicaid.gov/federal-policy-guidance/downloads/smd18002.pdf.
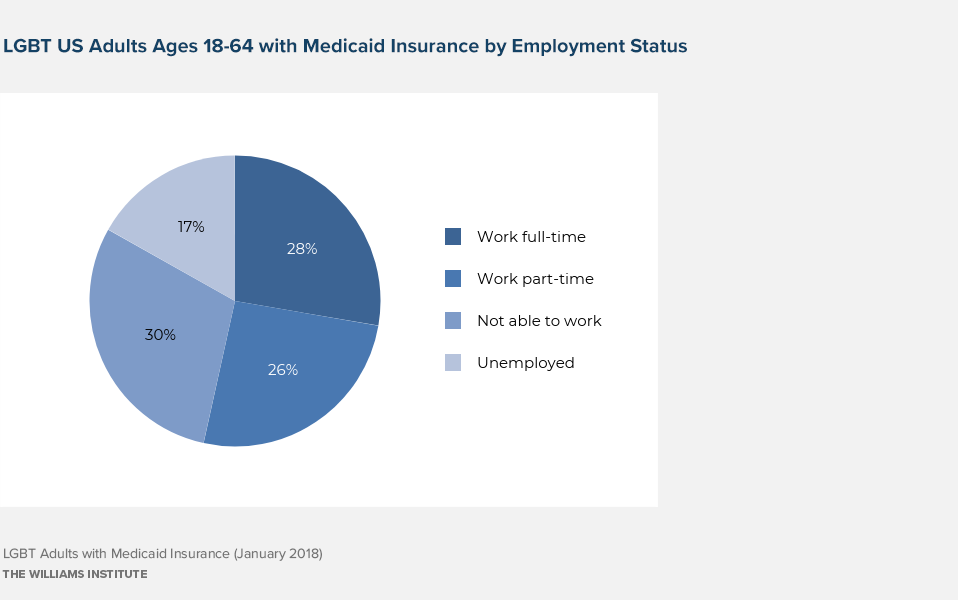
Among LGBT adults between the age of18 and 64 with Medicaid coverage, 16.6% reported that they were unemployed and 30.0% reported that they were unable to work in the prior four weeks in the 2015-2017 Gallup Daily Tracking Survey (Williams Institute unpublished analyses). Those who were unable to work in the prior four weeks may be vulnerable to insurance loss if they do not meet Medicaid disability criteria or other criteria for exemption from work and community service requirements.
Pear, R. (2018, January 11). Trump Administration Says States May Impose Work Requirements for Medicaid. The New York Times. Retrieved January 12, 2018, from https://www.nytimes.com/2018/01/11/us/politics/medicaid-work-requirements.html?_r=0
Williams Institute unpublished analyses from the 2015-2017 Gallup Daily Tracking Survey.