Report

Evidence of Employment Discrimination Based on Sexual Orientation and Gender Identity

An analysis of complaints filed with state enforcement agencies, 2008-2014
October 2015

In October 2015, 22 states and the District of Columbia expressly prohibit employment discrimination on the basis of sexual orientation. Of those, 19 states and D.C. also expressly prohibit discrimination on the basis of gender identity. This study provides an analysis of how frequently existing state employment non-discrimination laws are used by LGBT people.

Highlights
Filing rates of sexual orientation and gender identity discrimination complaints are similar to rates of complaints based on race and sex discrimination.
Approximately 4.6 complaints of sexual orientation and gender identity discrimination are filed for every 10,000 LGBT workers each year.
Sexual orientation and gender identity complaints will not overwhelm government agencies because the absolute number of these complaints filed is low.
Data Points
6.5M
workers in the US identify as LGBT
51%
of the LGBT workforce is not protected from sexual orientation or gender identity discrimination under state laws
4.9
complaints of race discrimination in employment are filed for every 10,000 workers of color each year
3.7
complaints of sex discrimination in employment are filed for every 10,000 female workers each year
Report

Executive Summary

As of October 2015, twenty-two states and the District of Columbia expressly prohibited employment discrimination on the basis of sexual orientation.1 Of those states, nineteen and the District of Columbia also expressly prohibited discrimination on the basis of gender identity.2 This report measures how frequently these laws are used by LGBT people, compared to how frequently race non-discrimination laws are used by people of color, and sex non-discrimination laws are used by women.

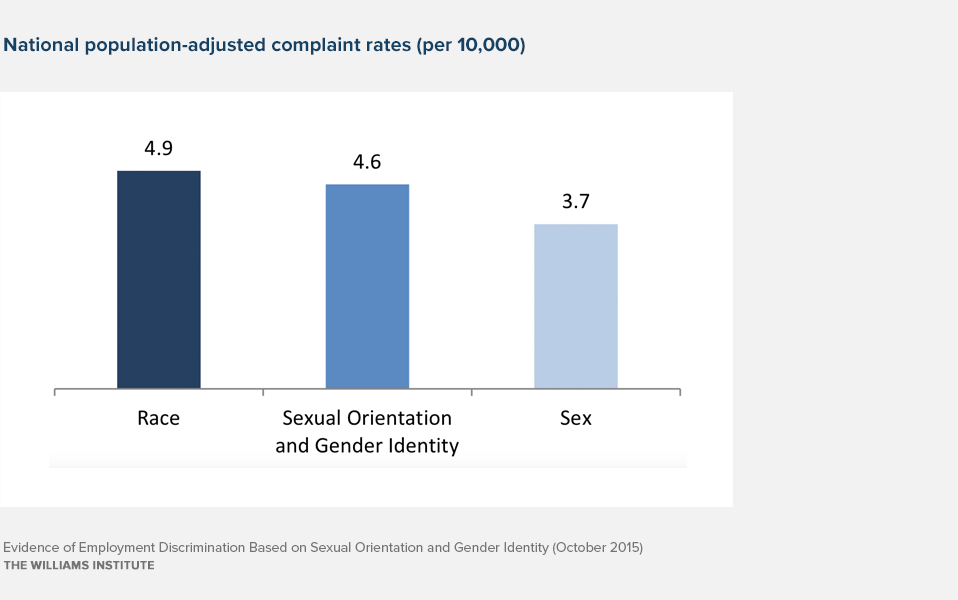
An aggregation of all available state-level data shows that sexual orientation and gender identity employment non-discrimination laws are used by LGBT people at a similar rate to the use of race non-discrimination laws by people of color and sex discrimination laws by women. Nationally, on average, approximately 4.6 complaints of sexual orientation and gender identity discrimination are filed for every 10,000 LGBT workers each year, compared to approximately 4.9 complaints of race discrimination filed for every 10,000 workers of color, and 3.7 complaints of sex discrimination filed for every 10,000 female workers.

The findings refute the argument that discrimination against LGBT people does not occur often enough to establish a need for protective laws. Additionally, even with similar filing rates, sexual orientation and gender identity complaints will not overwhelm government agencies because the absolute number of such complaints filed is low. The annual average number of sexual orientation and gender identity complaints for all 14 states that provided data was 1,600, compared to 9,800 complaints of race discrimination and 13,700 complaints of sex discrimination.

Download the full report

Evidence of Employment Discrimination Based on Sexual Orientation and Gender Identity

These states are: California, Colorado, Connecticut, Delaware, Hawaii, Illinois, Iowa, Maine, Maryland, Massachusetts, Minnesota, Nevada, New Hampshire, New Jersey, New Mexico, New York, Oregon, Rhode Island, Utah, Vermont, Washington, and Wisconsin. For purposes of this report, DC is considered a “state.”

All states listed above except New Hampshire, New York, and Wisconsin.