Brief

The LGBT Divide in California

A look at the socioeconomic well-being of LGBT people in California
January 2016

Using data from the 2010 U.S. Census and the Gallup Daily Tracking Survey, this report examines disparities in the socioeconomic well-being of LGBT people throughout California.

AUTHORS
  • Angeliki Kastanis
    Policy Analyst, Former
Highlights
There is as much disparity in the socioeconomic well-being of LGBT people within the state as throughout the rest of the United States.
Regional patterns for LGBT people mirror those of non-LGBT people, suggesting that broader demographic factors play a role in LGBT vulnerability.
The Centers/Southern Farm region reports the lowest level of acceptance of LGBT people and the Bay Area reports the highest.
Data Points
28%
of LGBT people in the Central/Southern Farm region have completed college
34%
of LGBT people in the North and Mountain region earn less than $24,000 annually
77%
of LGBT people living in the Pacific States live in California
Brief

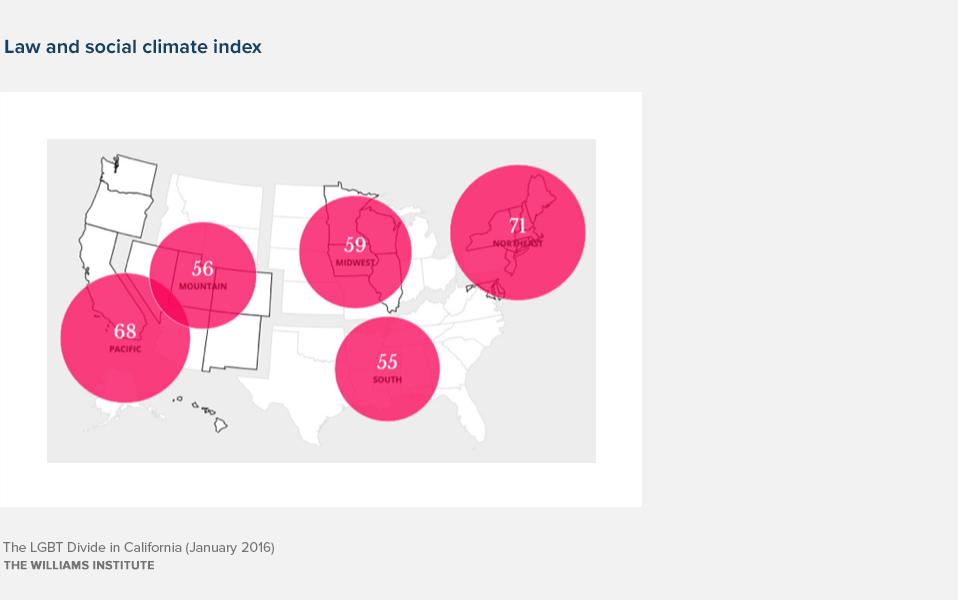
Within a rapidly changing landscape with respect to LGBT equality acrossthe United States, regional differences persist in the social acceptance oflesbian, gay, bisexual and transgender people.

In fact, the social and political climate toward LGB people and existing state-level legal protections based on sexual orientation and gender identity are highly intertwined. Our regional U.S. data interactive showed that states with protective laws for LGB people have social climate indices, a measure of public attitudes about LGBT people, that are much more LGB-supportive than the states that lack those protections.3

Our analysis suggests that more challenging legal and social climates decrease socioeconomic well-being of LGBT people. Poverty gaps are at their highest in the Midwest and Mountain states, where LGBT individuals are almost 1.5 times more likely to have incomes below $24,000 than non-LGBT people.

According to our U.S. regional data interactive, the LGBT Divide, the Pacific states are generally doing well when looking at measures of well-being. Data for the Pacific states are mainly driven by California’s numbers, as California accounts for 77% of all LGBT adults living in the Pacific states.

As a whole, LGBT people in California are doing better than the national estimates on indicators such as educational attainment, income, and money for healthcare.

4The Regions of California: Recommended Groupings of the Counties for Regional Studies.

San Francisco and Los Angeles are two large urban areas known to be particularly supportive environments for LGBT people. But how does the LGBT social climate measure up outside of those areas?

Using support for same-sex marriage as a proxy for measuring LGBT acceptance in the state, social climate varies by region. The Central/Southern Farm region reports the lowest level of acceptance (40%), while the Bay Area reports the highest (67%).

The urban areas of San Francisco and Los Angeles are home to larger proportions of LGBT college graduates compared to the rest of the state. However, the other four regions still have lower rates of educational attainment than the national estimate of 34%.

The LGBT population living in the Central/Southern Farm region reports the lowest rate of college completion (28%) in the state. This proportion is even lower than the LGBT college completion rate in the Southern (33%) and Midwest (29%) regions of the U.S.

The North and Mountain region has more than a third (34%) of theLGBT population earning less than $24,000 annually. This region is the only region in California that has a higher proportion of LGBT people with an income below $24,000 than the national LGBT estimate of 32%.

The proportion of LGBT people earning less than $24,000 per year in the North and Mountain region is comparable to the rate in the Southern (33%) and Midwest (35%) regions of the U.S.


10 Intersecting Dimensions of LGBT Poverty

The regional patterns of LGBT vulnerability in California mirror those for non-LGBT people. This suggests that broader demographic factors also play an important role in understanding LGBT vulnerability in California.

According to our 2013 report on patterns of poverty in the LGB community, as poverty rates for nearly all populations increased during the recession, LGB Americans remained more likely to be poor than non-LGB people.5

In the report, gender, race & ethnicity, education, and geography all influence poverty rates among LGB populations, and children of same-sex couples are particularly vulnerable to poverty. In addition to these factors, there are intersecting dimensions of LGBT poverty that must be considered in order to begin to address socioeconomic disparities and poverty within the LGBT community.

California Sub-Populations

Gender

LGBT females in California are doing worse than their male counterparts on socioeconomic indicators such as income and whether they have enough money for healthcare.

Race & Ethnicity

LGBT Latinos/as and LGBT African-Americans in California report similar rates of lower income compared to their non-LGBT counterparts. However, when compared to White LGBT people, there are significant disparities.

*Due to small sample sizes, we could only confidently report data for these three races.

Gender Identity

Currently, the well-being of transgender individuals is not captured by any national population-based survey. In a survey of over 6,000 transgender and gender non-conforming people, respondents experienced poverty, unemployment and health risks at much higher rates than the general population.6

Immigration Status

Non-citizen individuals in same-sex couples in California are about 3 times more likely to be uninsured than citizens, whether by birth or naturalization. Non-citizens are also more likely to have an income less than $24,000.

In California, there is a geography to socioeconomic disparities for individuals and families. This is evident in large coastal urban centers, as well.

This geography of disparities is also present for LGBT people and families. Addressing LGBT disparities in California means addressing disparities morewidely throughout the state and local regions.

Download the brief

The LGBT Divide in California

Census Population Estimate 2014; Gallup Daily tracking survey 2012-2014

Census 2010

http://williamsinstitute.law.ucla.edu/lgbtdivide

The Regions of California: Recommended Groupings of the Counties for Regional Studies. (2002). Sacramento: California Department of Social Services, Research and Development Division.

M.V. Lee Badgett, Laura E. Durso, & Alyssa Schneebaum. (2013). New Patterns of Poverty in the Lesbian, Gay, and Bisexual Community. Los Angeles: Williams Institute.

Findings of the National Transgender Discrimination Survey: California Results. (2011) Washingtion: National Center for Transgender Equality and National Gay and Lesbian Task Force.